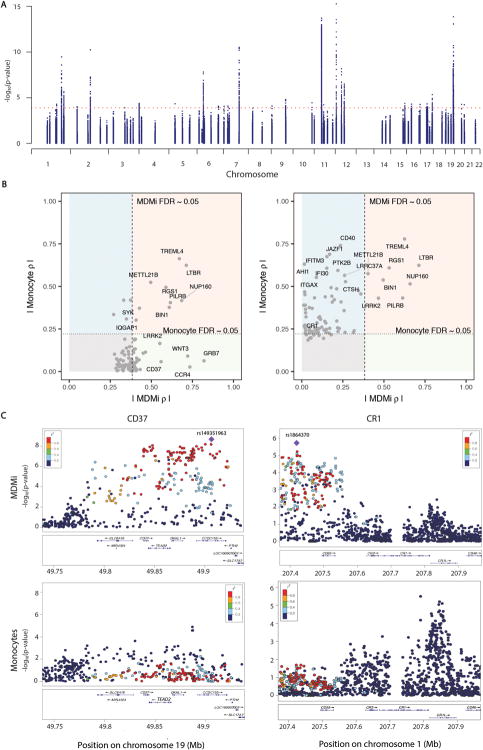
Fig. 2. Genotype-induced differential gene expression varies between monocytes and MDMi.
Using a Fluidigm high-throughput qPCR chip, we measured the expression of 94 genes found in loci associated with susceptibility to AD, MS or PD in MDMi differentiated from the monocytes of 94 young healthy subjects of European ancestry with genome-wide genotype data. (A) Manhattan plot of eQTL results for the 94 genes measured in MDMi. N = 95 biological replicates per gene. Each dot is one SNP; selected SNPs include all of those found within 1 Mb of the transcription start site of the profiled gene. The x-axis denotes the physical position of the SNP, and the y axis reports the significance of the SNP’s association with the expression of the nearby gene (eQTL result). The red line highlights the threshold of significance in our analysis. (B) We compared our MDMi eQTL results to those of our previously published monocyte eQTL results derived from N = 211 young, healthy subjects of European ancestry (13). In the left panel, we plot the top eQTL SNP for each gene in the MDMi data; the x-axis reports the absolute value of the effect size (ρ) of the SNP in MDMI while the ρ in the monocyte data is presented in the y-axis. The threshold of significance (FDR<0.05) is shown by dotted lines in each dimension. The light red quadrant contains those loci with consistent effects in both cell types, while the light green quadrant contains those loci which have a significant association only in MDMi cells. The light blue quadrant contains those loci with an effect in monocytes that is not significant in our current MDMi analysis. The right panel displays the best SNP for each locus in the monocyte data. (C) Locus zoom plots highlight the regional distribution of associations in two loci, CD37 and CR1, which have very different eQTL associations in the two cell types. Each dot is one SNP in these figures, with the physical position captured on the x-axis and eQTL significance on the y-axis. The location of genes in this locus is shown below the SNPs. The top eQTL SNP for the MDMi data is shown as a purple diamond, and the other SNPs are colored by the extent of linkage disequilibrium (r2) with the lead SNP. In the monocyte plots, the SNP colors are defined by the lead MDMi SNP, highlighting the fact that the haplotype driving association in MDMi does not have a strong effect in monocytes. MDMi N = 95 biological replicates, monocytes N = 211 biological replicates.

