
Figure 1.
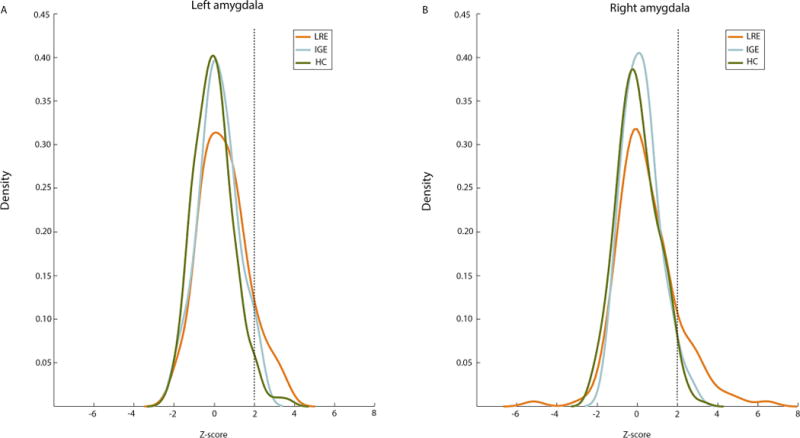
Kernel density plots for amygdala volume z-scores in the LRE, IGE, and HC groups. The estimate of the probability density function is plotted against (A) left and (B) right amygdala volume z-scores. The dotted line represents the z-score cutoff for amygdala enlargement (z > 2). (A) The left amygdala distribution across groups shows a larger percentage of individuals with amygdala enlargement in the LRE group (12%) relative to the IGE (6%) and HC (4%) groups. (B) Similarly, there were a greater percentage of individuals with right amygdala enlargement in the LRE group (14%) relative to the IGE (3%) and HC group (3%). LRE=Localization Related Epilepsy; IGE=Idiopathic Generalized Epilepsy; HC=Healthy Controls.