Figure 1.
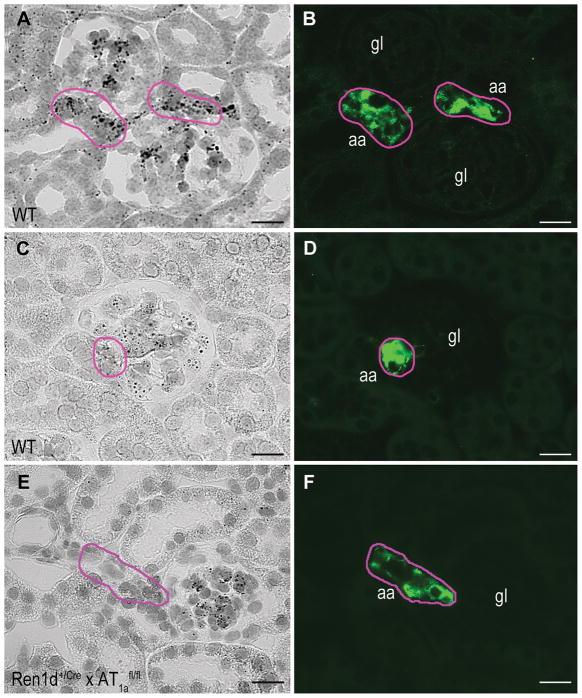
Intrarenal distribution of AT1a receptor-mRNA expression (A) and AT1b receptor-mRNA expression (C) in WT kidneys can be observed as black dots. AT1a and AT1b receptor-mRNA was visualized by in situ hybridization with the RNAscope method. To identify renin-producing cells (RPCs) immunostaining of renin (green) was performed on the same slices (B, D). Pink labels indicate renin positive areas. Conditional renin-cell specific AT1a-deficient mice (Ren1d+/Cre x AT1afl/fl) show intraglomerular and tubular AT1a receptor distribution but no expression in RPCs (E, F). Magnification 400x, Scale bars = 20 μm, gl indicates glomerulus; aa, afferent arteriole.

