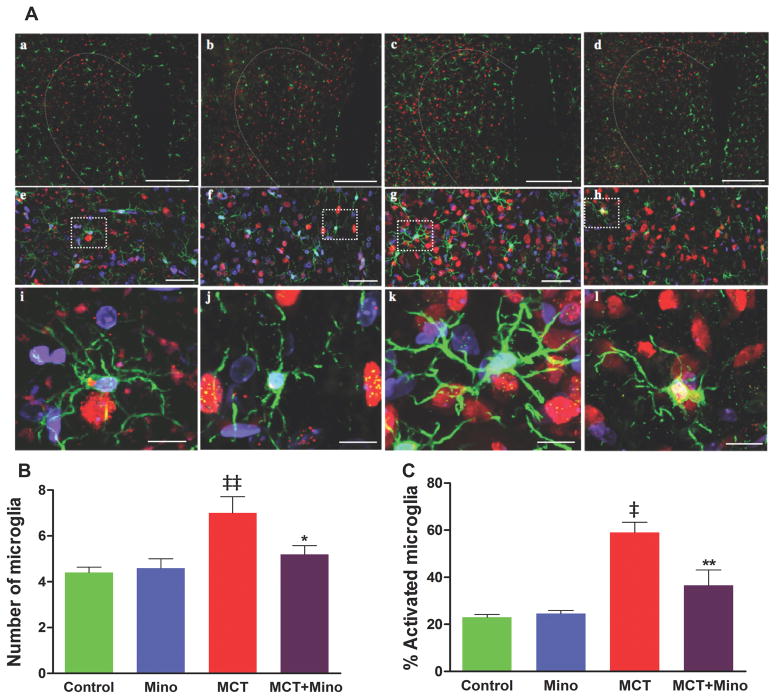
Figure 4. MCT-induced microglial cells are inhibited by ICV minocycline treatment.
A, Representative micrographs show the paraventricular nucleus (PVN) sections stained with anti-ionized calcium binding adaptor molecule1 (Iba1) antibody indicative of microglia (green), anti-NeuN indicative of neurons (red) and DAPI showing DNA (blue). (a–d) (20x; scale bar= 200 μM). (e–h) Higher magnification (60x; scale bar=50 μM), and enlarged view of microglia showing resting microglia in control (i), minocycline (j) and MCT+ minocycline (l) compared with activated microglia in MCT-treated group (k). B, Total number of microglia (resting/activated) and C, % of activated microglia within the 200×200 μm2 area of PVN under each treatment condition. ‡p<0.001, ‡‡ p<0.01 vs. control and minocycline; **p<0.01, *p<0.05 vs. MCT (n= 6 rats/group). Data are represented as mean ± SEM, analyzed using one-way ANOVA with Newman-Keuls post hoc test. 2-way ANOVA showed significant interactions between MCT and minocycline on number of microglia (p=0.047) and % activated microglia (p=0.0086).

