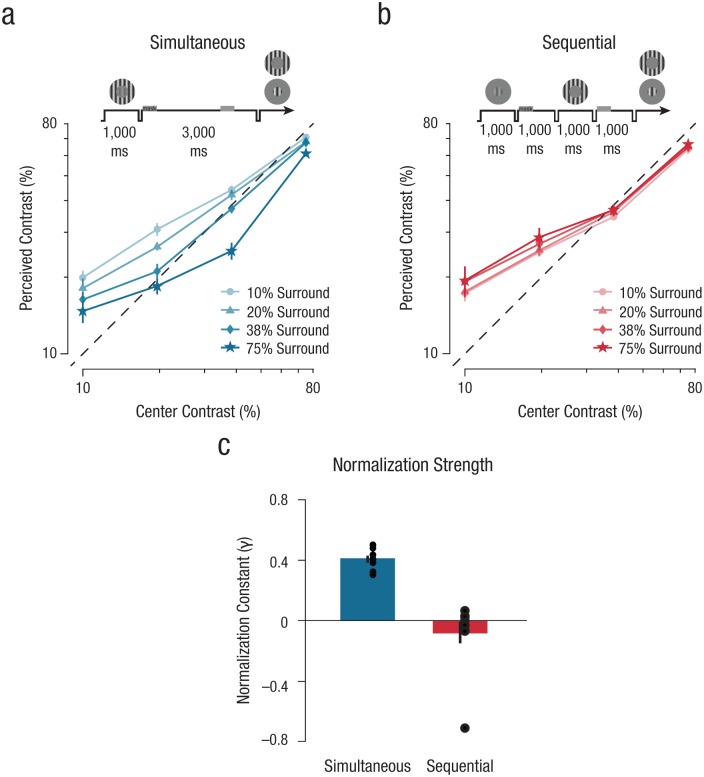
Fig. 4.
Results from Experiment 2. Perceived contrast of the center stimuli is shown separately for the (a) simultaneous and (b) sequential conditions. Data points reflect the apparent center contrast estimates across all contrast levels, averaged over observers (N = 10), for each surround contrast condition (10%–75% surround). Dashed black lines indicate veridical contrast estimation. Error bars denote ±1 SEM (note that in some cases the error bars are smaller than the data points). Schematics above the graphs illustrate the general experimental design. Normalization strength estimates (c) were derived from the normalization model. Parameter estimates illustrate the influence of the surround on perceived contrast of the center stimulus for both the simultaneous and sequential conditions (perception = blue; visual memory = red; see the Supplemental Material for additional parameter estimates). Error bars denote ±1 SEM.

