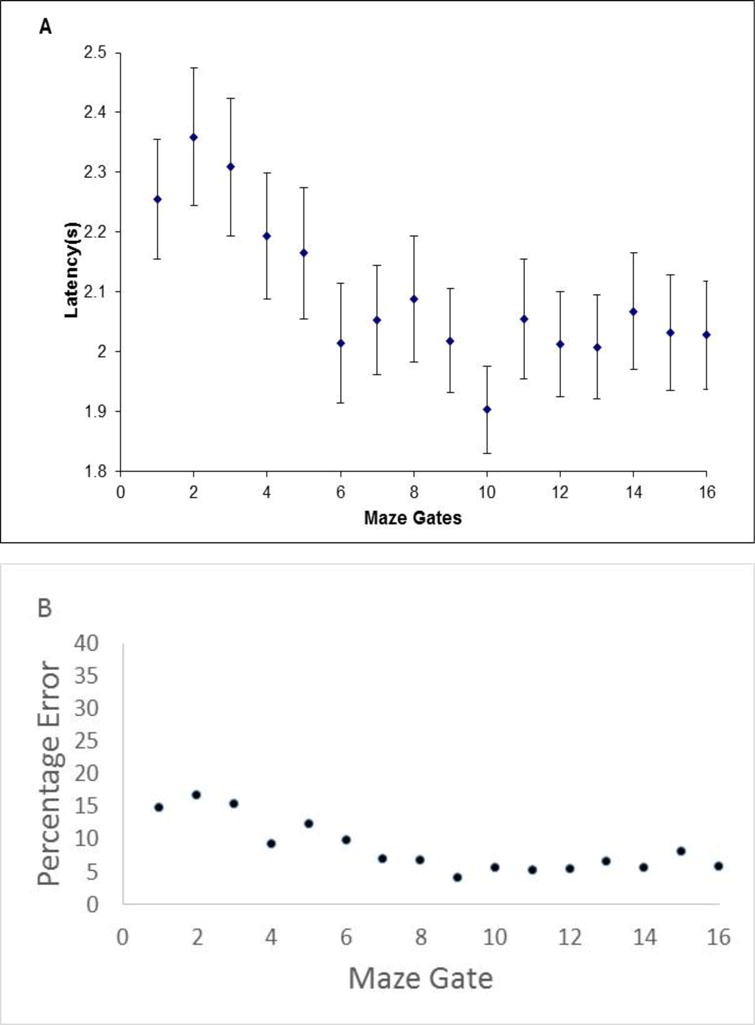
Figure 3.

A. Monkey Obi’s mean latency for trial-decline responses on Impossible maze displays in Experiment 2 (16-gate condition). Each data point is framed by its 95% confidence interval. B. Obi’s percentage error when the constriction lay at each gate along the run of the maze.
