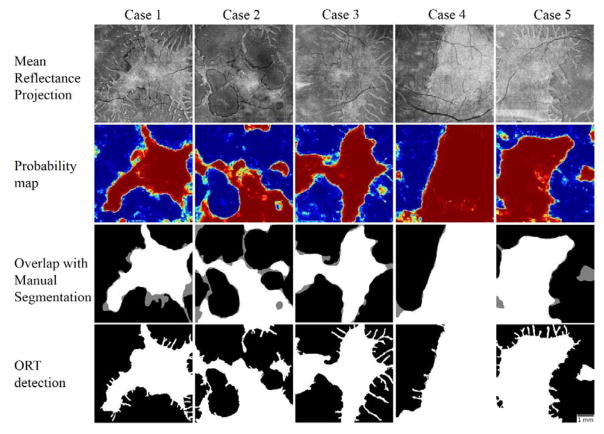
Figure 6.
Processing results in 5 cases with choroideremia. The en face images generated by mean projection of reflectance values show the preserved vs disrupted EZ regions. Color-coded probability maps generated by the random forest classifier show preserved regions in red and disrupted regions in blue. The overlap of automatically detected areas with manual segmentation show white areas detected by both (agreement) and gray areas detected by only one of them (disagreement). The images generated after post-processing with a local active contour routine shows reasonable retrieval of ORT. Scale bar represents 1 mm.

