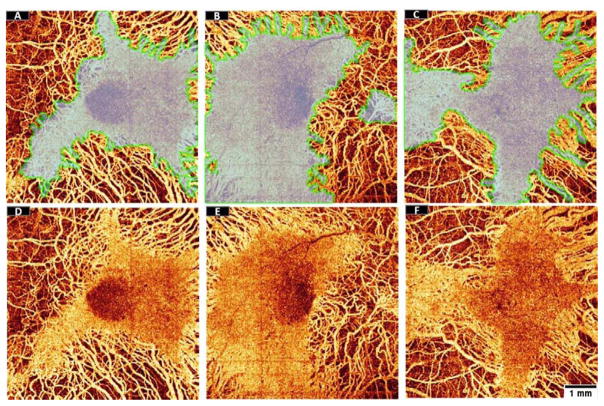
Figure 7.
Visual inspection of the preserved EZ area detected by the random forest classifier from three choroideremia eyes (transparent region outlined by a green line) overlaid (A–C) on en face angiograms of choroidal flow (D–F). The structural data used to identify preserved EZ area and the flow data used to identify choroidal loss were acquired simultaneously in a single scan. Scale bar represents 1 mm.

