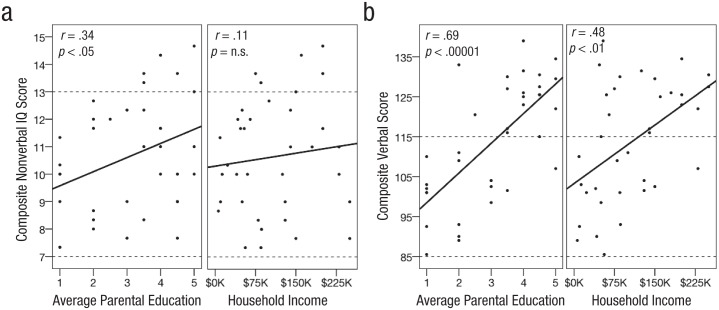
Fig. 1.
Scatterplots showing composite (a) nonverbal and (b) verbal score as a function of parental education level (mother and father averaged) and household income. Standardized nonverbal assessments evaluated fluid reasoning, nonverbal working memory, and processing speed. Standardized verbal assessments evaluated vocabulary, receptive and expressive morphosyntax, and verbal working memory skill. Dotted lines indicate the average range of scores (within 1 standard deviation of the population mean). Solid lines indicate best-fitting regressions.

