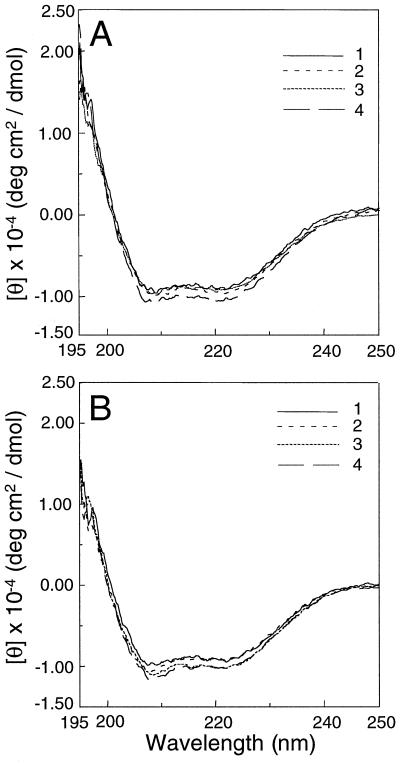
Figure 3.
The CD spectra of control (A) and R286L (B) ACC synthase. Buffer 1 (curve 1) contains 20 mm Tris-HCl (pH 7.5), 20% (w/v) glycerol, 25 mm EDTA, 2 mm DTT, and 150 mm NaCl; buffer 2 (curve 2) is buffer 1 supplemented with 100 μm AdoMet; buffer 3 (curve 3) is buffer 1 supplemented with 10 μm PLP; and buffer 4 (curve 4) is buffer 1 supplemented with both 100 μm AdoMet and 10 μm PLP. The measurements were done at room temperature.

