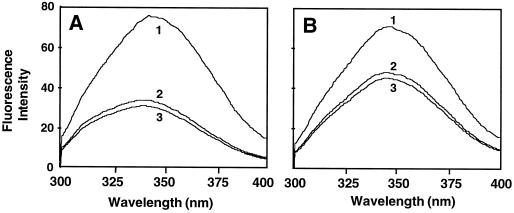
Figure 5.
Fluorescence spectra of control (A) and R286L (B) ACC synthase. Protein samples were dissolved in 10 mm Tris/HCl buffer (pH 7.5) to a final concentration of 17 nm. Spectra were obtained at a scan rate of 1 nm s−1. Spectrum 1, Protein sample alone; spectrum 2, protein plus PLP; spectrum 3, protein plus both PLP and AdoMet.

