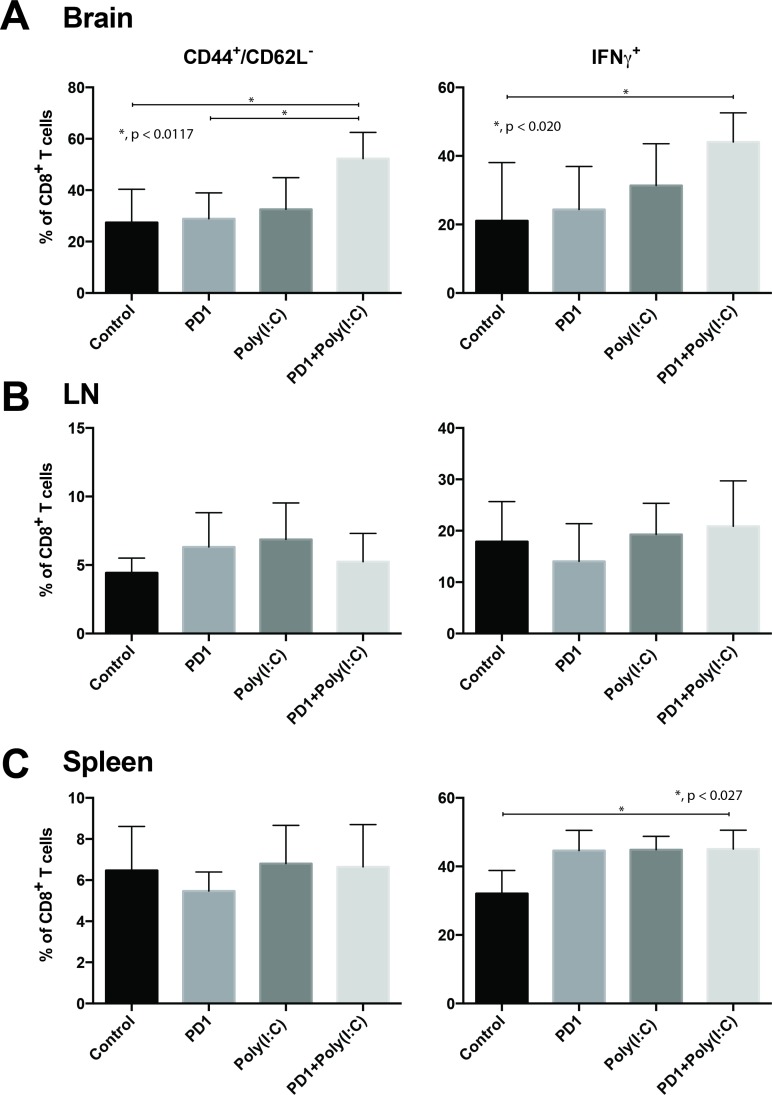
Figure 3. TLR3 agonist combined with PD-1 blockade promotes tumor infiltration of effector CD8+/CD44+/CD62L-/IFN-γ T cells.
Bar charts of T cells isolated from tumor bearing brains (A), deep cervical lymph nodes (B), and spleen (C). Charts present expression of CD44, CD62L, and IFN-γ in CD8+ T cells. Data are represented as mean ± SEM. All experiments repeated in triplicate with ≥5 mice per arm. P-values were determined by ANOVA, and, *denotes statistical significance (p < 0.05).

