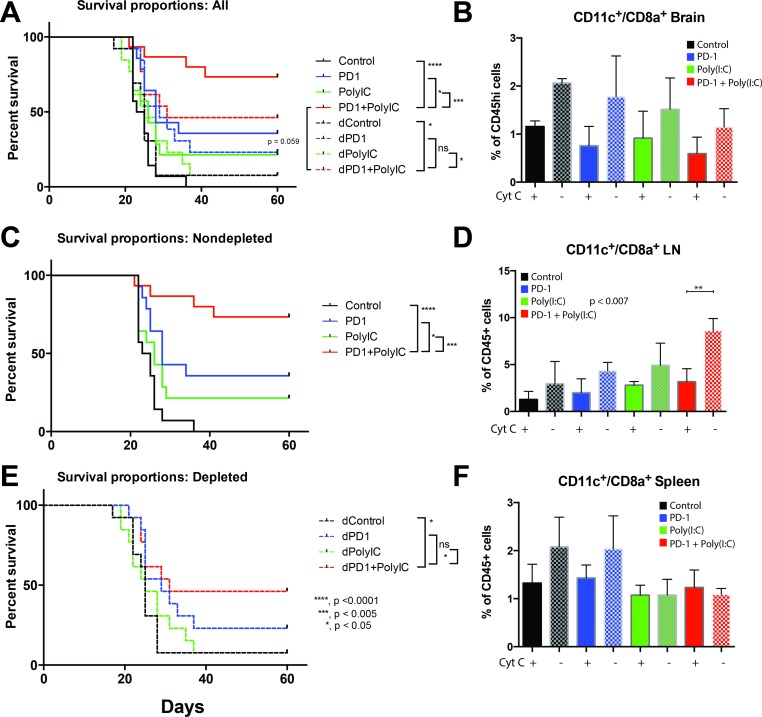
Figure 5. Depletion of cross-presenting DCs abolishes the survival benefit of TLR3 activation + anti–PD-1.
Cross-presenting DCs were depleted by intravenous injection of equine cytochrome c. (A) Kaplan-Meier curve with control, anti-PD-1, Poly(I:C), and anti-PD-1+poly(I:C) treatment groups in non-depleted mice (solid lines) and depleted mice (dotted lines). The survival benefit of combination therapy is lost when DCs are depleted (B) Bar chart showing the percentage of CD11c+/CD8a+ cells isolated from the brain in tumor bearing mice in different treatment groups. Solid bars = depleted mice, checker bars = non-depleted mice). (C) Kaplan-Meier curve with control, anti-PD-1, Poly(I:C), and anti-PD-1+poly(I:C) treatment groups in non-depleted mice. (D) Bar chart showing the percentage of CD11c+/CD8a+ cells isolated from the lymph node in tumor bearing mice in different treatment groups. Solid bars = depleted mice, checker bars = non-depleted mice). Interestingly, the anti-PD-1+poly(I:C) treated mice showed a significant increase in CD11c+/CD8a+ cells in lymph nodes that was eliminated by cytochrome c treatment. (E) Kaplan-Meier curve with control, anti-PD-1, Poly(I:C), and anti-PD-1+poly(I:C) treatment groups in depleted mice. (F) Bar chart showing the percentage of CD11c+/CD8a+ cells isolated from the spleen in tumor bearing mice in different treatment groups. Solid bars = depleted mice, checker bars = non-depleted mice). All groups had 15 mice per arm. *denotes statistical significance (p < 0.05) in survival. Data are represented as mean ± SEM.

