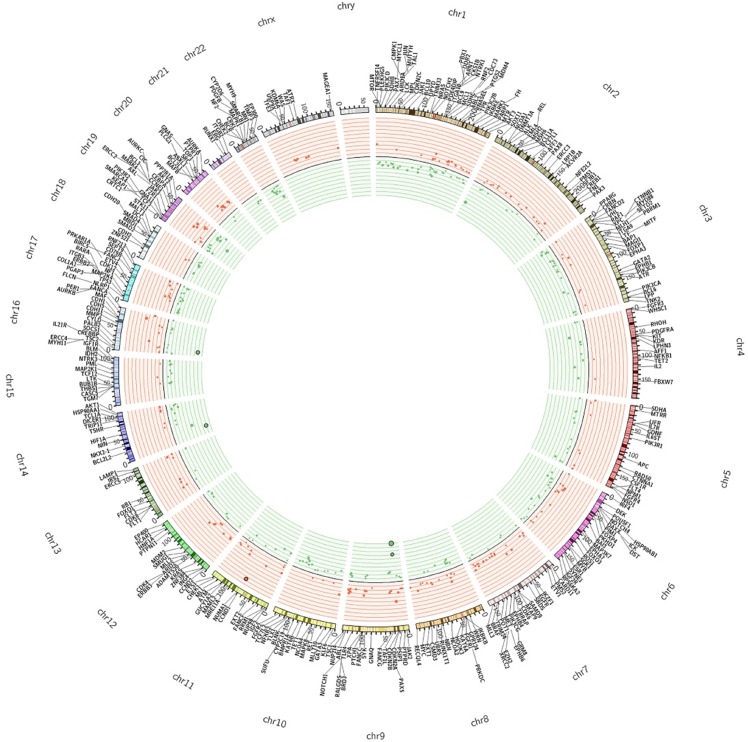
Figure 2. The Circos plot summarizes all CNAs detected in colon cancers samples under analysis.
The two outermost tracks report the distributions of 409 genes along the genome; the innermost tracks reported the values of the log2 CN ratio. Genes with altered CN are distinguished by colour as deletions (green) and amplifications (red).

