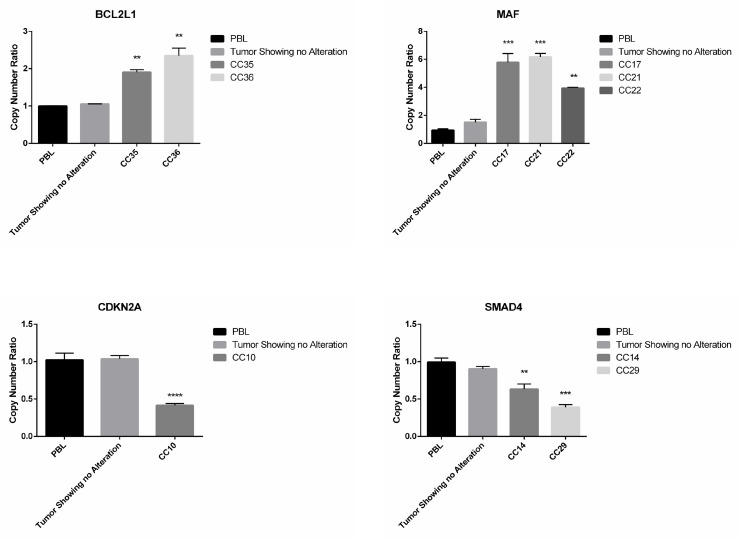
Figure 4. Q-PCR analysis of samples presenting CNAs in SMAD4, CDKN2A, MAF and BCL2L1.
Q-RT-PCR analysis of CN losses in SMAD4 and CDKN2A and of CN gains in MAF and BCL2L1. Values are expressed as CN ratio using as standard the median value of 3 PBL samples set as 1. Tumors presenting normal CN for the specific genes were also included in each experiment. Statistical significance as indicated when confronted with PBL.

