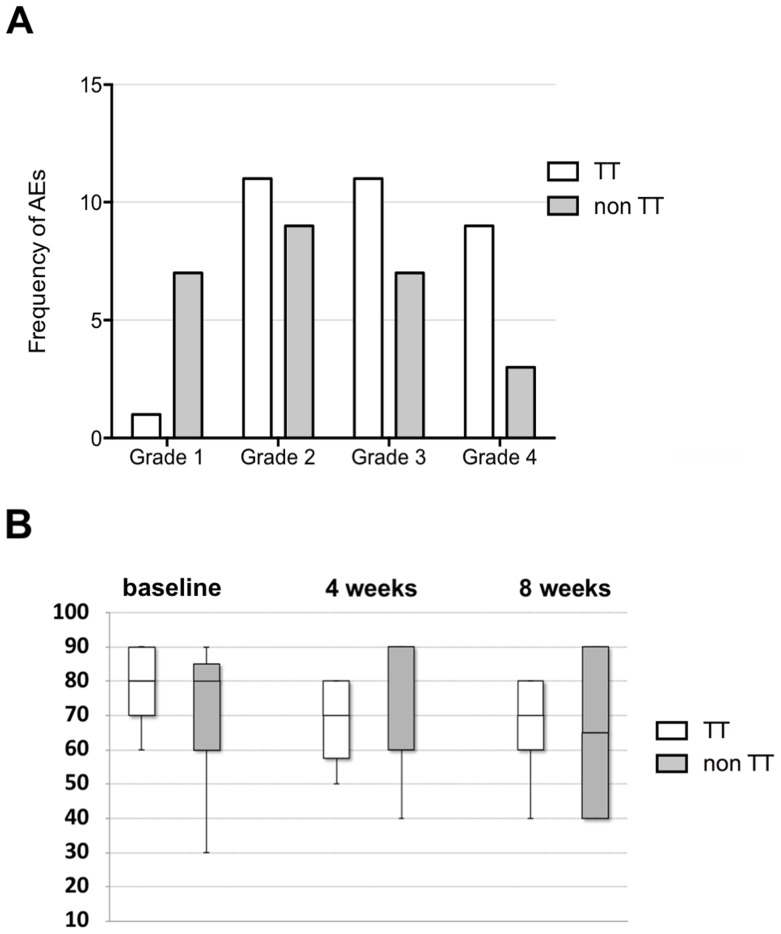
Figure 3. Adverse events and quality of life.
(A) Frequency of adverse events in patients receiving targeted therapy (TT) compared to those who did not (non TT) (total number of n=15 evaluable patients). The frequency of Grade 2, 3 and 4 AEs did not differ significantly between the two patient groups (Chi square P=0.98, 0.54 and 0.12 respectively). However, Grade 1 AEs were significantly less in patients receiving targeted therapy (Chi square P=0.009). (B) QOL is assessed by comparing performance status according to Karnofsky/Lansky status between patients receiving targeted therapy (TT) and those who did not (non TT). Performance status was not significantly different at baseline (P=0.33) as well as at four (P=0.96) and eight weeks (P=0.89) following enrollment/ start of therapy between the two patient groups.

