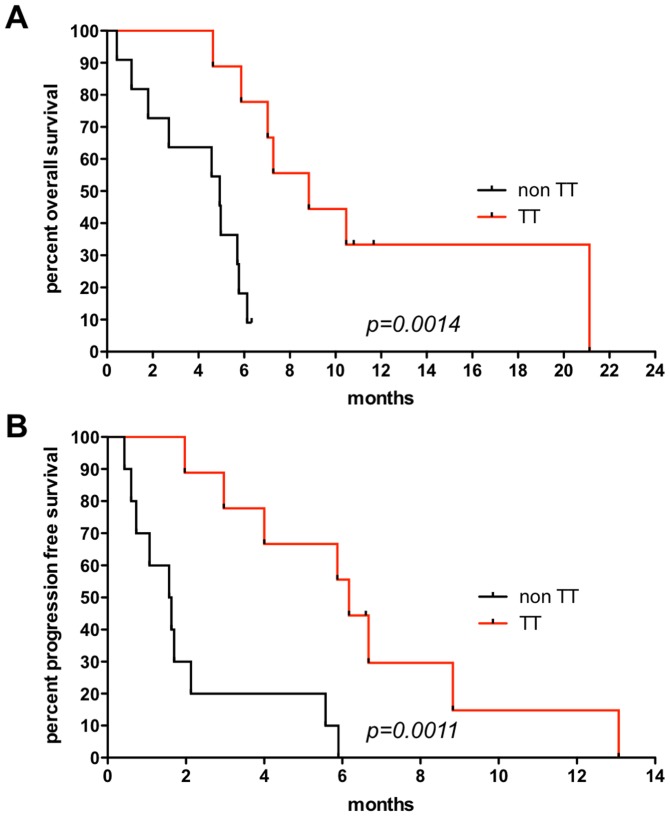
Figure 4. Survival analysis.
(A) Overall survival (OS) using the Kaplan-Meier estimator between patients receiving targeted therapy (TT=9) and those who did not (non TT=11). Median OS=8.83 months in the TT group versus 4.93 months in the non TT group. Log-rank P=0.0014, Gehan-Breslow-Wilcoxon P=0.0025, with a hazard ratio (HR) of 0.1435 and a 95% confidence interval (CI) ranging from 0.044 to 0.471. (B) Progression free survival (PFS) using the Kaplan-Meier estimator between patients receiving targeted therapy (TT=9) and those who did not (non TT=10 patients since PFS was not available for PT18). Median PFS=6.17 months in the TT group versus 1.6 months non TT group. Log-rank test (P=0.0011) and the Gehan-Breslow-Wilcoxon test (P=0.0015) with a HR of 0.1448, 95% CI of 0.045 to 0.463.

