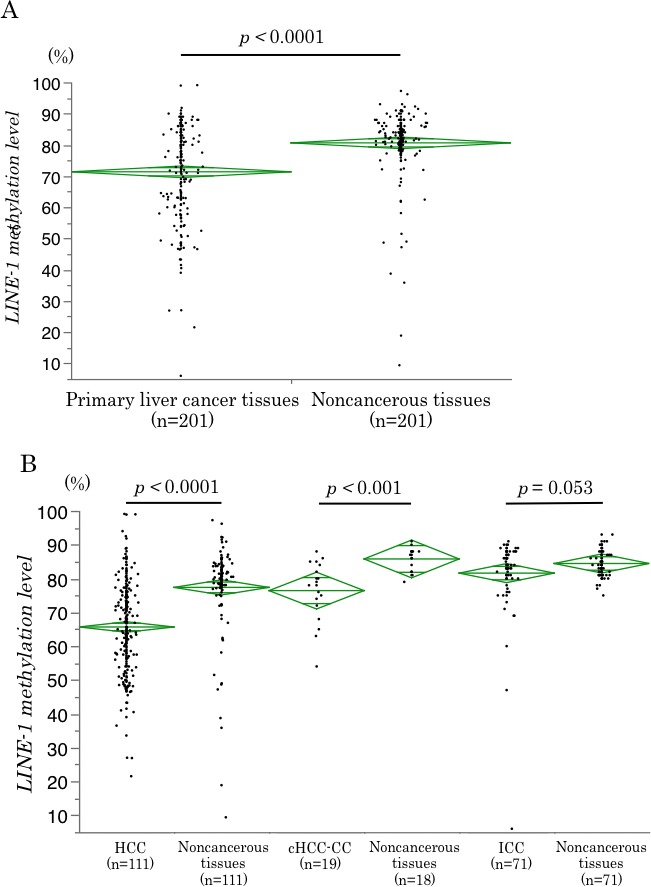
Figure 2. LINE-1 methylation levels in cancerous and noncancerous tissues.

(A) LINE-1 methylation levels in cancerous tissues and noncancerous liver parenchyma in 201 PLC patients. The levels were significantly lower in the cancerous tissues than in the noncancerous liver tissues (p < 0.0001). (B) LINE-1 methylation levels in cancerous tissues and noncancerous liver tissues for each histological subtype of PLC. The levels were significantly lower in the cancerous tissues than in the noncancerous liver parenchyma for HCC (p < 0.0001) and cHCC-CC (p < 0.001), but not for ICC (p = 0.053). The diamonds mean 95% confidence interval of the mean value.
