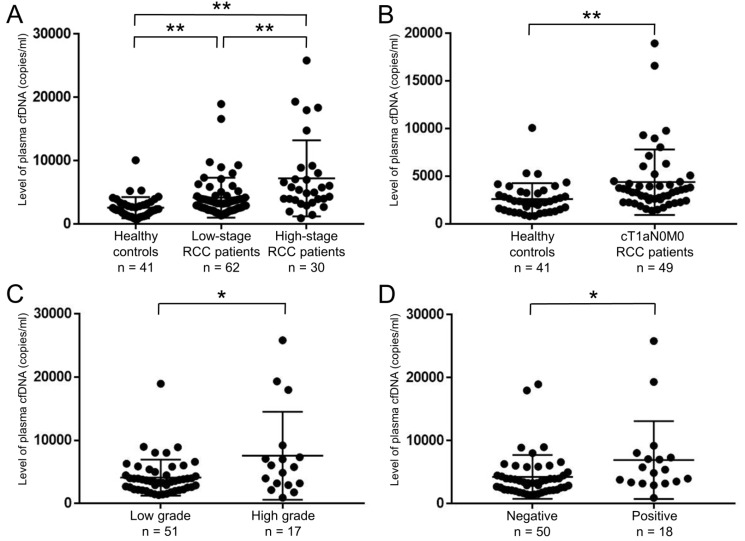
Figure 1. Level of plasma cfDNA was able to distinguish between healthy controls and RCC patients.
(A) Levels of plasma cfDNA were quantified by real-time PCR. Comparison of cfDNA levels among healthy controls (n = 41), low-stage (stage I–II) RCC patients (n = 62), and high-stage (stage III–IV) RCC patients (n = 30). **p < 0.01 (Dunn’s multiple comparison test). (B) Comparison of cfDNA levels between healthy controls (n = 41) and cT1aN0M0 RCC patients (n = 49). **p < 0.01 (Wilcoxon test). (C) Levels of plasma cfDNA were significantly higher with Fuhrman nuclear grade 3 and 4 (high grade) than without grade 3 and 4 (low grade) (n = 68). *p < 0.05 (Wilcoxon test). (D) Levels of plasma cfDNA were significantly higher with positive LVI than negative (n = 68). *p < 0.05 (Wilcoxon test).

