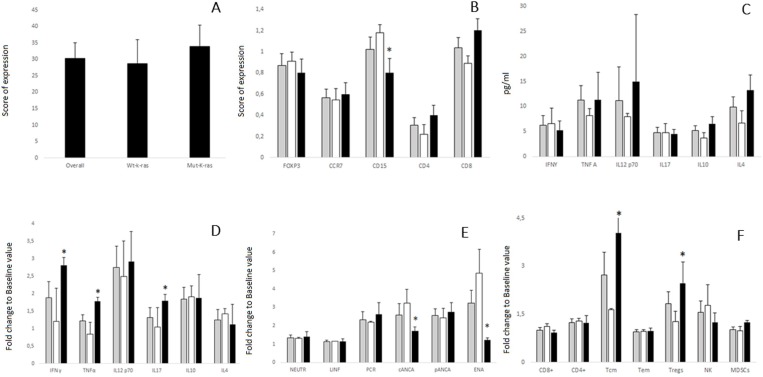
Figure 1.
(A) Immuno-histochemical analysis of TS expression in the primary tumor of 41 mCRC patients enrolled in the TSPP/VAC-1trials [All patients (overall), patients with k-ras wt (wt-k-ras) and patients with mutated k-ras (mut-k-ras)]. Results are expressed as number of positive cells per HPF ( ± SE). No difference in TS expression was detected between the two subsets of patients. (B) Immuno-histochemical analysis of tumor infiltrating T cells expressing FoxP3 (Treg), CCR7 (Tcm/em), CD4, or CD8 and inflammatory cells expressing CD15. This analysis was carried out in the primary tumor of 41 mCRC patients who received TSPP vaccine [ ], whose 22 with k-ras wt [□] and 19 with mutated k-ras [■]. Results are expressed as number of positive cells per HPF ( ± SE). No differences were detected between the two subsets of patients with exception of CD15+ cells, which showed a reduced expression in patients with k-ras mut (P = 0.046), Asterisk (*) represents statistically significant difference. (C) Cytokine Multiplex analysis- Evaluation of baseline serum levels of IFNɣ, TNFα, IL12p70, IL17/A, IL10, IL4 of 41 mCRC patients who received TSPP vaccine 41 mCRC patients who received TSPP vaccine [
 ], wt [□] and 19 with mutated k-ras [■]. Results are pg/ml ( ± SE). No differences were detected between the two subsets of patients at baseline. (D) Evaluation of fold change to baseline values of serum levels of IFNɣ, TNFα, IL12p70, IL17/A, IL10, and IL4 of 41 mCRC patients who received TSPP vaccine [
 ], whose 22 with k-ras wt [□] and 19 with mutated k-ras [■]. Results are expressed as fold induction relative to baseline indicated as 1 ( ± SE). Asterisk (*) represents statistical significance to between k-ras mut vs k-ras wtpatients (P < 0.05); hashtag (#) represents statistical significance to baseline value (P < 0.05). (E) Evaluation of fold change to baseline values of Neutrophils, lymphocytes, CRP, cANCApANCA and ENA of 41 mCRC patients who received TSPP vaccine [
 ], whose 22 with k-ras wt [□] and 19 with mutated k-ras [■]. Results are expressed as fold induction relative to baseline indicated as 1 ( ± SE). Asterisk (*) represents statistical significance to between k-ras mut vs k-ras wt patients (P < 0.05); hashtag (#) represents statistical significance to baseline value (P < 0.05). (F) Flow cytometry- Evaluation of fold change to baseline levels of peripheral blood cells expressing the following phenotypes: CD3+CD4+, CD3+CD8+, or CD8+CD45Ra-CCR7+ (Tcms), CD8+CD45Ra-CCR7- (Tems), CD3+CD4+FoxP3+ (Tregs), CD3+CD56dimCD16bright(cytotoxic NK), and myeloid derivative suppressive cells (MDSCs). This analysis was performed on 41 mCRC patients who received TSPP vaccine [
 ], whose 22 with k-ras wt [□] and 19 with mutated k-ras [■]. Results are expressed as fold induction relative to baseline indicated as 1 ( ± SE). Asterisk (*) represents statistical significance to between k-ras mut vs k-ras wt patients (P < 0.05); hashtag (#) represents statistical significance to baseline value (P < 0.05).

