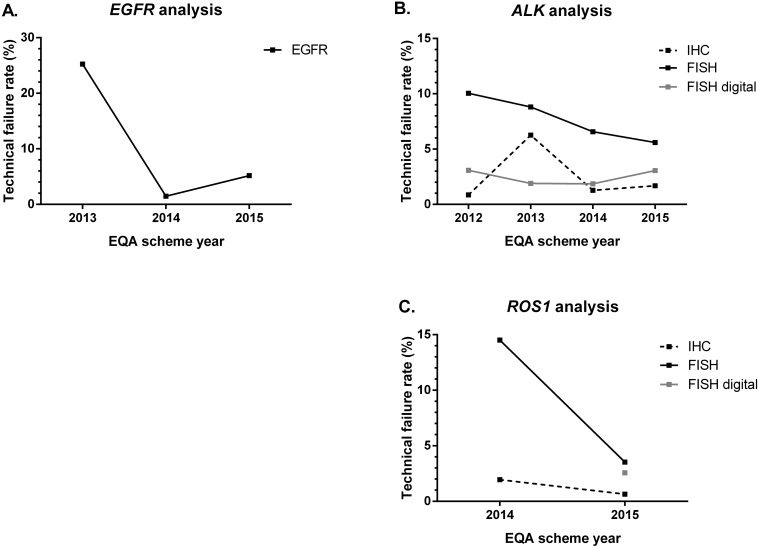
Figure 2. Technical failure rates (in percentage) across EQA scheme years.
Educational samples were not taken into account for calculation of the percentages. (A) Error rates for EGFR variant analysis. N= 428 (2013), 1296 (2014), 1026 (2015). (B) Error rates for ALK analysis in different subschemes. FISH: n = 269 (2012), 500 (2013), 928 (2014), 555 (2015); FISH digital: n = 260 (2012), 424 (2013), 324 (2014), 555 (2015); IHC: n = 232 (2012), 576 (2013), 864 (2014), 475 (2015). (C) Error rates for ROS1 analysis in different subschemes. FISH: n = 448 (2014), 340 (2015); FISH digital: n = 272 (2015); IHC: n = 310 (2014), 155 (2015). ALK, anaplastic lymphoma kinase; EGFR, epidermal growth factor receptor; EQA, external quality assessment; FISH, fluorescence in-situ hybridization; IHC, immunohistochemistry; N, Number of participants; ROS1, proto-oncogene 1 tyrosine-protein kinase.

