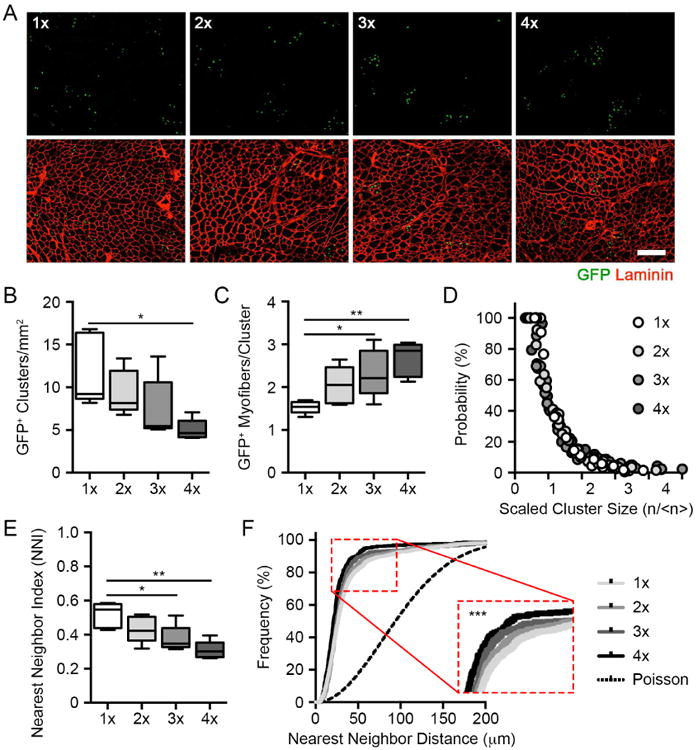
Figure 4. MuSCs follow a model of population asymmetry and neutral drift with repeated injury.

(A) Composite images of GFP+ myonuclei in regenerated muscles following serial BaCl2 injury. Scale bar, 100 µm.
(B-C) Quantification of GFP+ myofiber cluster density and the number of regenerated myofibers per cluster following serial BaCl2 injury (n = 5).
(D) Cumulative, scaled cluster size distribution following serial BaCl2 injury (199-446 clusters).
(E-F) Quantification of nearest neighbor index and cumulative distribution frequency derived from spatial analyses of GFP+ nuclei following serial BaCl2 injury (n = 5).
Data are represented as average ± SEM (***P < 0.001, **P < 0.01, *P < 0.05). See also Figure S4.
