
Fig. 3.
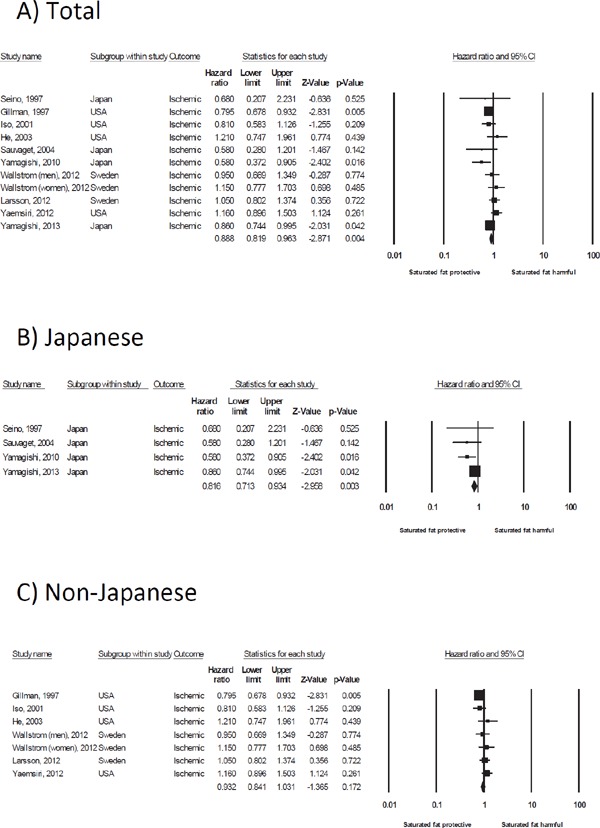
Forest plot of the hazard ratio for saturated fat and the risk of ischemic stroke in total (A), Japanese (B), and non-Japanese (C) populations. A summary of the hazard ratios is shown in the last row of the forest plot data (◆). CI, confidence interval