Fig. 1.

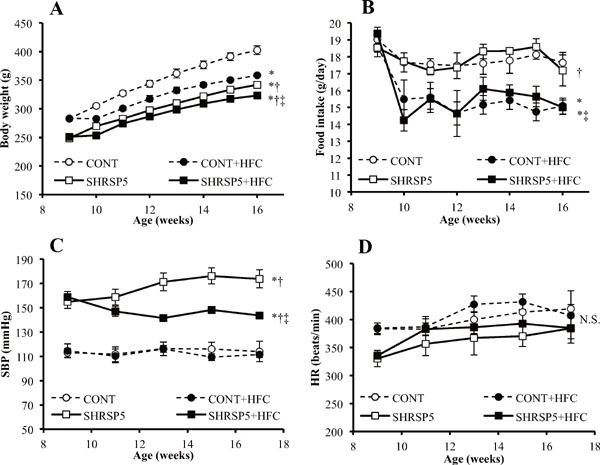
Changes in body weight (A), food intake (B), systolic blood pressure (SBP; C), and heart rate (HR; D) at 916 weeks of age
The following 4 groups were used: CONT group; WKY rats were fed a stroke-prone (SP) diet, CONT + HFC group; WKY rats were fed a high-fat and high-cholesterol (HFC) diet, SHRSP5 group; SHRSP5/Dmcr rats were fed an SP diet, and SHRSP5 + HFC group; SHRSP5/Dmcr rats were fed an HFC diet, which induce the non-alcoholic steatohepatitis (NASH). Data are shown as means ± standard error (SE); n = 5 in each group. *P < 0.05 vs. the CONT group, †P < 0.05 vs. the CONT + HFC group, ‡P < 0.05 vs. the SHRSP5 group.
