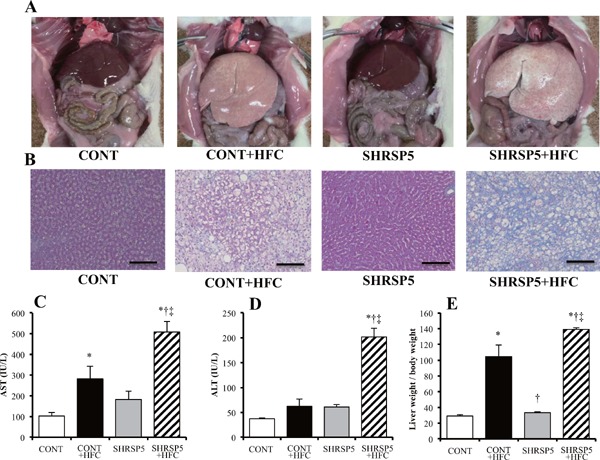
Fig. 2.

Pathological liver conditions in the 4 groups at 18 weeks of age
A: Macroscopic findings of the liver in the abdominal cavity. B: Masson trichrome staining for hepatic fibrosis. Scale bars = 100 µm. C and D: Hepatic function in blood biochemistry assays. The serum levels of aspartate aminotransferase (AST) and alanine aminotransferase (ALT) were measured. E: Liver weight corrected by body weight. All data are shown as means ± standard error (SE); n = 5 in each group. *P < 0.05 vs. the CONT group, †P < 0.05 vs. the CONT + HFC group, ‡P < 0.05 vs. the SHRSP5 group.
