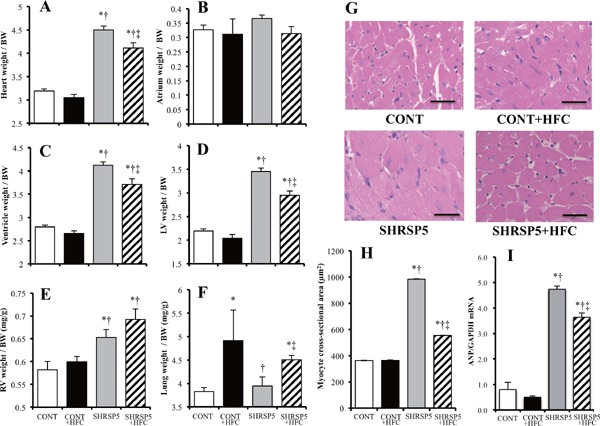
Fig. 3.

Evaluation of left-ventricle (LV) hypertrophy in the 4 groups at 18 weeks of age
AF: Organ weights corrected by body weight (BW) for heart (A), atrium (B), ventricle (C), LV (D), right-ventricle (RV) (E), and lung (F). G: Hematoxylin and eosin (HE) staining of cross sections of the LV myocardium. Scale bars = 100 µm. H: Cross-sectional areas of cardiac myocytes calculated by those in (G). I: Quantitative RT-PCR analysis of atrial natriuretic peptide (ANP). The amount of mRNA was normalized to that of GAPDH mRNA and then expressed relative to the mean value of the CONT group. All data are shown as means ± standard error (SE); n = 5 in each group. *P < 0.05 vs. the CONT group, †P < 0.05 vs. the CONT + HFC group, ‡P < 0.05 vs. the SHRSP5 group.
