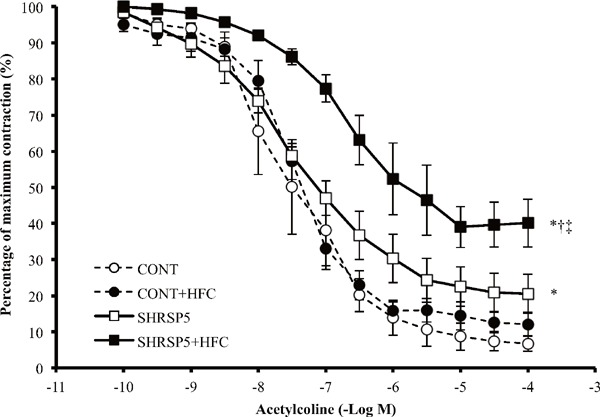
Fig. 7.

Endothelium-dependent relaxation curve induced by acetylcholine (ACh) of aortic rings
Statistical analysis for the 4 groups was performed at the ACh 10−4M. All data are shown as means ± standard error (SE); n = 5 in each group. *P < 0.05 vs. the CONT group, †P < 0.05 vs. the CONT + HFC group, ‡P < 0.05 vs. the SHRSP5 group.
