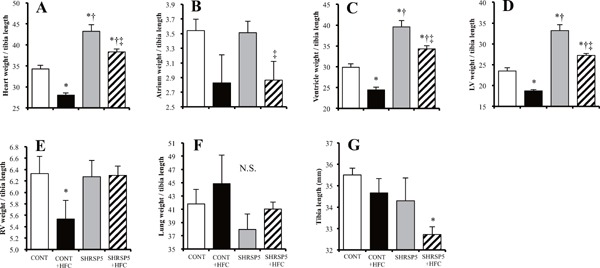
Supplemental Fig. 2.

Evaluation of left ventricular (LV) hypertrophy in the 4 groups at 18 weeks of age
AF: Organ weights (heart (A), atrium (B), ventricle (C), LV (D), right ventricle (RV) (E), and lung (F)) corrected by tibial length (G). All data are shown as mean ± standard error (SE); n = 5 in each group. *P < 0.05 vs. the CONT group, †P < 0.05 vs. the CONT + HFC group, ‡P < 0.05 vs. the SHRSP5 group.
