
Fig. 4.
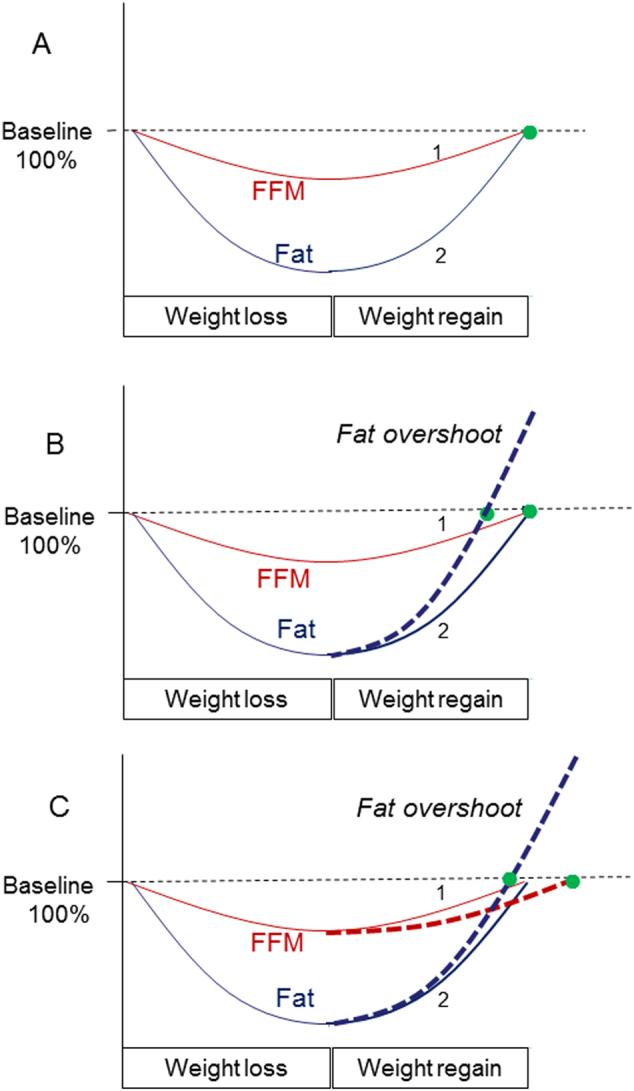
Schematic diagrams depicting dynamics of body composition recovery, with fat and FFM synchronization a or desynchronization b, c during weight recovery. The Y axis represent changes in fat and FFM as a percentage of initial (baseline) values, and the numbers 1 and 2 represent synchronized fat and FFM recoveries, respectively, as determined by the intrinsic lean-fat partitioning characteristic of the individual. a Fat and FFM reached complete (100%) recovery simultaneously; there is no fat overshoot. b Fat recovery alone is accelerated (either by adaptive thermogenesis or by excessive hyperphagia or by both) such that this catch-up fat results in complete (100%) fat recovery before complete FFM recovery; this desynchronization (represented by the gap between the green-filled circles) results in collateral fattening and fat overshoot. c Altered intrinsic lean-fat partitioning at the expense of FFM (i.e., slower recovery of FFM and hence energy diverted to recovery of fat) also results in complete fat recovery being reached before complete FFM recovery; this desynchronization (represented by the gap between the green-filled circles) results in collateral fattening and fat overshoot