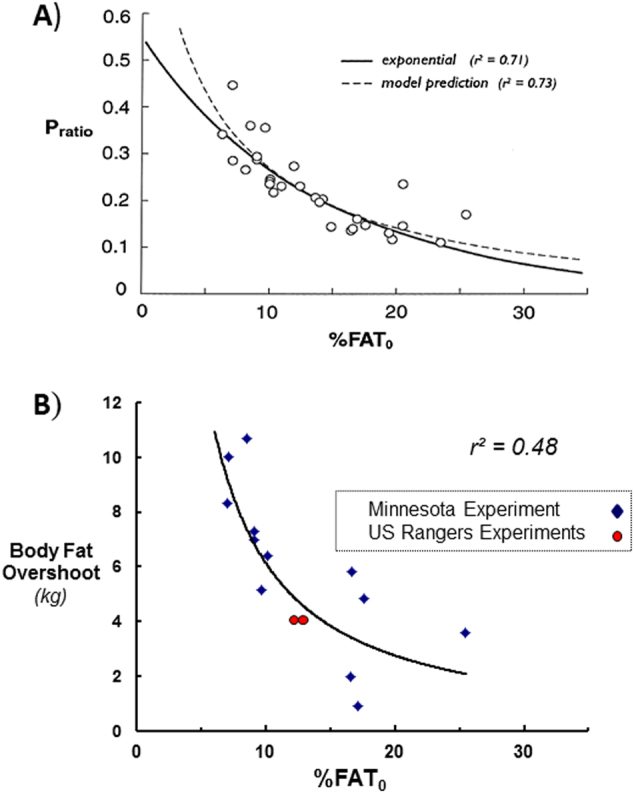
Fig. 6.

a Relationship between the proportions of energy mobilized as protein (P-ratio) during weight loss due to semistarvation and the initial percentage body fat (%FAT0) in men of the Minnesota Experiment. Note that P-ratio (expressed in energy terms) is a proxy of the fraction of weight loss as FFM (i.e., ΔFFM/ΔWeight). Adapted from Dulloo and Jacquet [13]. b Relationship between the extent of fat overshooting (kg excess fat regained) and the initial (pre-starvation) percentage body fat (%FAT0). The exponential curve is drawn from data on the 12 men who participated in all phases of the Minnesota Experiment (data for each individual is represented by a blue-filled diamond symbol). The mean values for men (n = 10) participating in each of the Army Ranger training experiments for which body composition data are available [25, 26] are shown as red-filled circles. Adapted from Dulloo et al. [24]
