Fig. 1.
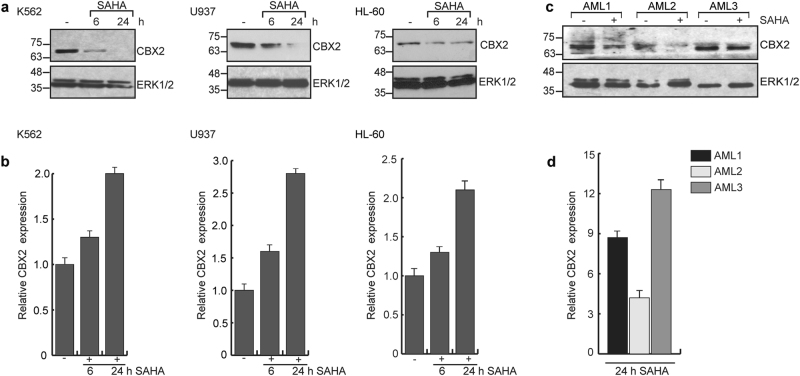
SAHA induces CBX2 degradation. a Western blot analysis of CBX2 in K562, U937, and HL-60 cells untreated (−) or treated with 5 μM SAHA at indicated times. ERK1/2 was used as loading control. b Real-time qPCR analysis for CBX2 expression in K562, U937 and HL-60 cells untreated (−) or treated with 5 μM SAHA at indicated times. Error bars indicate standard deviation (STD) of three biological replicates. p-value is not significant. c Western blot of CBX2 in 3 primary blasts derived from AML patients untreated (−) or treated with 5 μM SAHA at 24 h. d Real-time qPCR analysis of CBX2 expression levels (relative to ctr) in three primary blasts derived from AML patients untreated or treated with 5 μM SAHA at 24 h. Results show CBX2 relative fold change in SAHA-treated blasts compared to untreated counterpart. Error bars represent STD of three technical replicates. p-value is not significant

