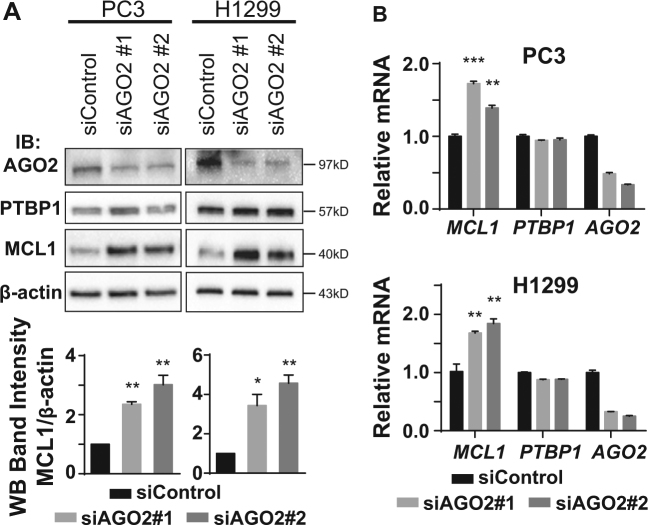
Fig. 2. Knockdown of AGO2 upregulates MCL1.
PC3 and H1299 cells were transfected with either siControl or one of two individual siRNAs targeting AGO2 (siAGO2#1 and siAGO2#2) for 48 h. a AGO2, PTBP1, MCL1, and β-actin levels were detected by western blotting. Relative MCL1 band intensity was quantified and normalized against β-actin. b Relative MCL1, PTBP1, and AGO2 mRNA levels were quantified by RT-qPCR using ACTB as the internal control. Data is shown as mean ± SEM, n = 3. The statistical significance was determined using unpaired Student’s t-test where *p < 0.05; **p < 0.01; ***p < 0.001.

