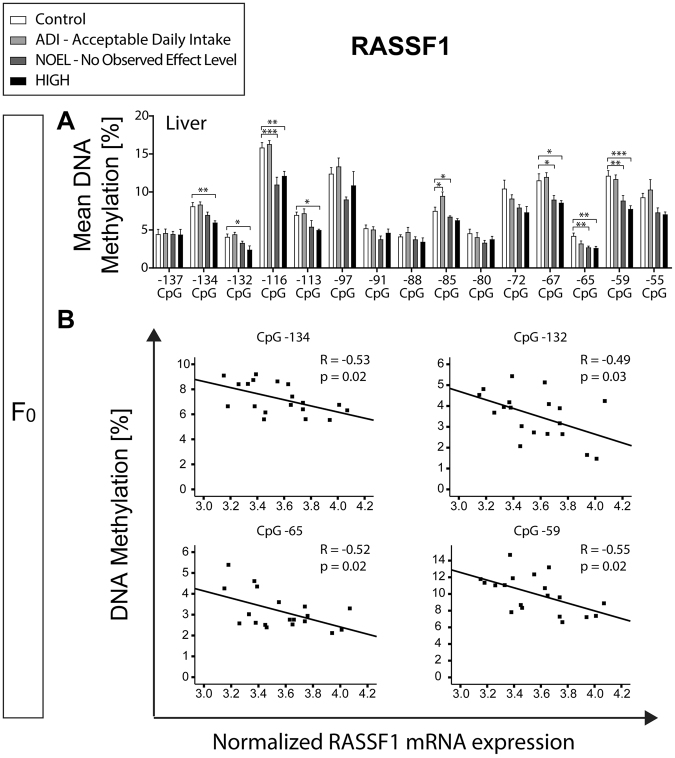
Figure 6.
E2 induced DNA hypomethylation in the RASSF1 5′ UTR of the F0 liver. Bar charts represent mean ± SEM of % DNA methylation per group in different shades of grey (0.05, 10, and 1000 μg/kg body weight/day represented by ADI, NOEL, and HIGH dose, respectively). *, **, and *** indicate statistical significance with respect to the control group at p < 0.05, p < 0.01, and p < 0.001, respectively (n = 4–6 per group). (A) Liver DNA methylation showing most pronounced hypomethylation at CpG −134, −132, −116, −113, −85, −72, −67, −65, and −59. (B) Significant correlation of mRNA expression of RASSF1 with its methylation levels at CpG −134, −132, −65, and −59.

