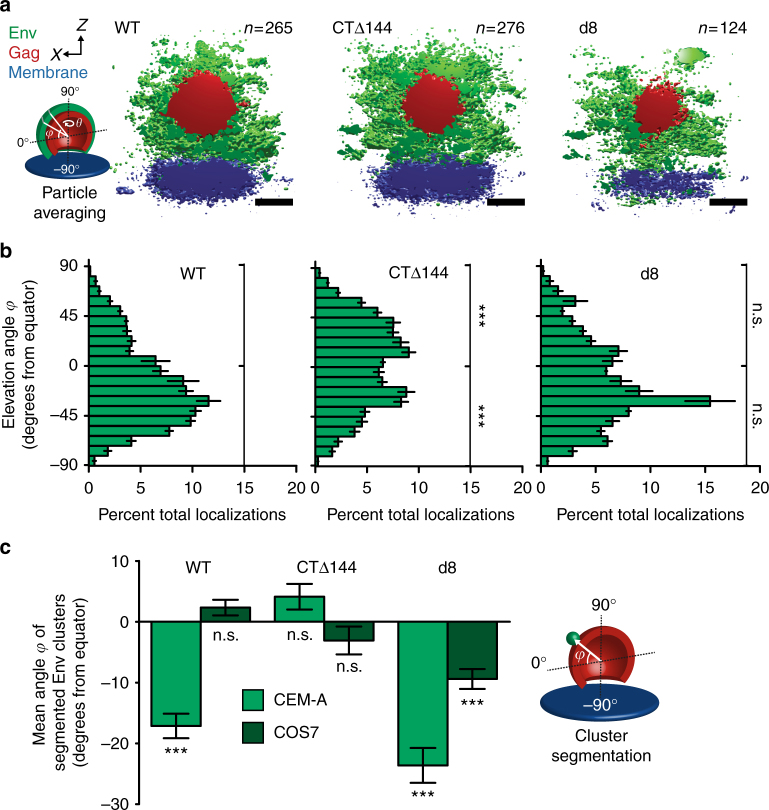
Fig. 2.
The angular distribution of Env on the surfaces of virus particles is dependent on cell type and the Env-CT. a Cross-sections of aligned and averaged virus assembly sites produced in CEM-A cells (WT, left, n = 265 particles from three cells; CTΔ144, center, n = 276 particles from four cells; d8, right, n = 124 particles from four cells). Isosurface thresholds are 1.0 × 10⁻³ (Env, green), 3.0 × 10⁻³ (Gag, red), and 4.5 × 10⁻³ (plasma membrane, blue) localizations × nm−3. Scale bars are 100 nm. b Probability distributions of WT- (left), CTΔ144- (center), and d8-Env (right) about averaged clusters produced in CEM-A. The elevation angle (φ) was binned in 9° increments, according to the estimated sampling resolution (Supplementary Fig. 12). Error bars indicate s.d. of three pairs of random half data sets. Upper and lower hemispheres were integrated, error from each bin was added in quadrature, and probabilities were t-tested against WT-Env. c The mean angular distributions of each Env genotype were measured explicitly from clusters of Env localizations on individual virus assembly sites for both cell types tested (see distributions in Supplementary Fig. 14). Error bars indicate s.e.m. Mean angular probabilities were tested for significant differences from a normal distribution centered at 0°. ***P < 0.0001 and n.s. not significant by two-way ANOVA and Bonferroni post-test

