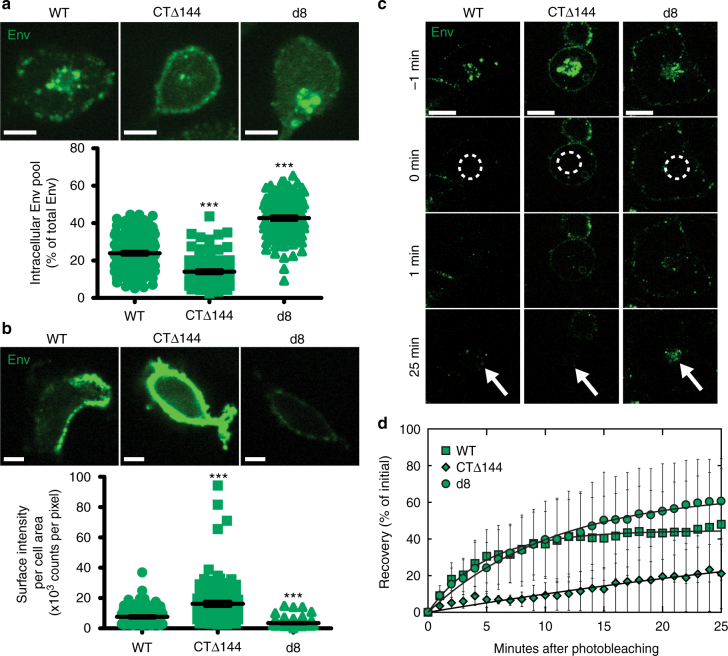
Fig. 4.
Intracellular retention of Env in CEM-A cells correlates with angular distributions of Env at assembly sites. a Pulse-chase-labeled Env (anti-Env Fab b12-Atto565; 15 min) demonstrates greater intracellular accumulation of d8-Env (43 ± 1%, n = 123 cells) and WT-Env (24 ± 1%, n = 142 cells) relative to CTΔ144-Env (14 ± 1%, n = 99 cells) in CEM-A cells. Scale bars are 10 μm (representative images above). b Labeling of fixed cells with anti-Env 2G12- and b12-AF647 probes demonstrates reduced levels of surface-exposed WT- and d8-Env relative to CTΔ144-Env. Scale bars are 10 µm (representative images above). a, b Bar and error bars represent mean and s.e.m. c Representative FRAP time-lapse highlighting the rates of recovery of intracellular Env pools. Time points are relative to photobleaching (bleach region, white dashed circle). Scale bars are 20 μm. d FRAP experiments demonstrate reduced internal compartment recovery rates for CTΔ144-Env (0.016 ± 0.01 s−1) relative to WT-Env (0.21 ± 0.01 s−1, relative to CTΔ144-Env P < 0.0001) and d8-Env (0.092 ± 0.01 s−1, relative to CTΔ144-Env P = 0.0036). Error bars indicate s.d. (n = 4 cells per genotype). *** indicates significance from WT with P < 0.0001. All statistical tests used a two-tailed unpaired t-test

