Fig. 5.
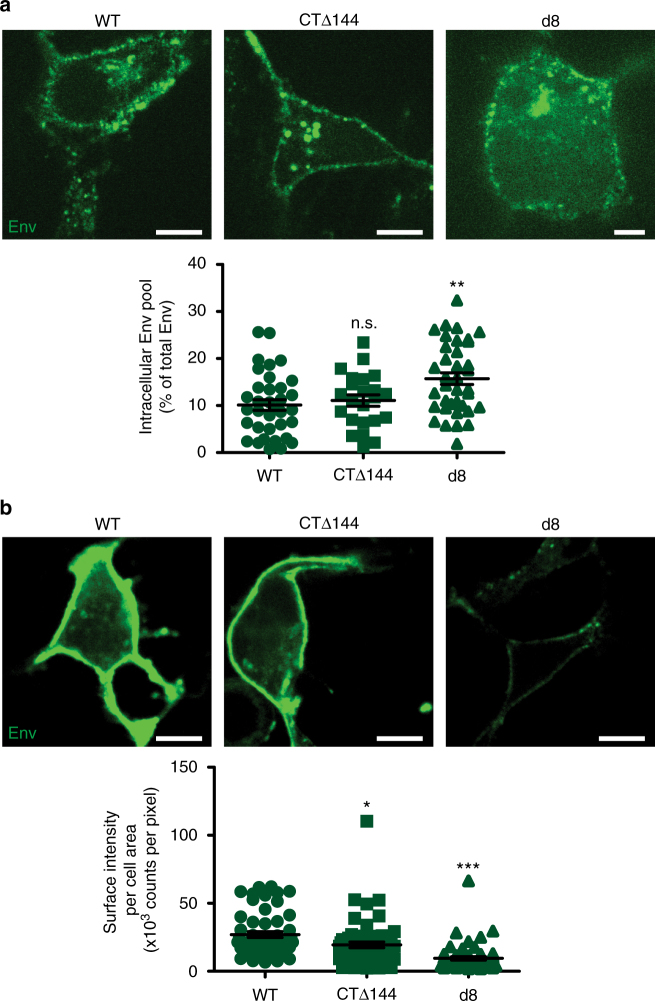
Surface labeling of Env in COS7 cells shows cell-type dependence of Env-CT trafficking and intracellular levels. Infected cells were either fixed directly and surface labeled for Env or pulse-chase labeled live to highlight endocytosed Env pools using the full b12 and 2G12 IgG's conjugated to AF647 or monovalent Fab b12-Atto565, respectively. a Representative examples of pulse-chase labeled COS7 cells expressing WT- (left), CTΔ144- (middle), and d8-Env (right) (above). Scale bars are 20 μm. Comparison of the intracellular levels of Env normalized to the total Env signal of each cell (below). There was no significant difference between WT- (n = 35) and CTΔ144-Env (n = 23), while the intracellular fraction of d8-Env (n = 36) was significantly greater than in WT. Bar and error bars indicate mean and s.e.m. b Representative equatorial slices (above) from COS7 cells expressing WT- (left), CTΔ144- (middle), and d8-Env (right), labeled for surface-exposed Env only (above panel). Scale bars are 20 μm. Quantified comparison of surface staining intensities for WT- (n = 54), CTΔ144- (n = 61), and d8-Env (n = 57) normalized to cell area (bottom). These results show that in COS7 cells, significantly less Env is displayed on the cell surface for both mutants compared to WT. Bar and error bars represent mean and s.e.m. ***P < 0.0001, **P = 0.0058, and *P = 0.0156 represent significance or n.s. not significant from WT-Env as assessed by two-tailed unpaired t-test

