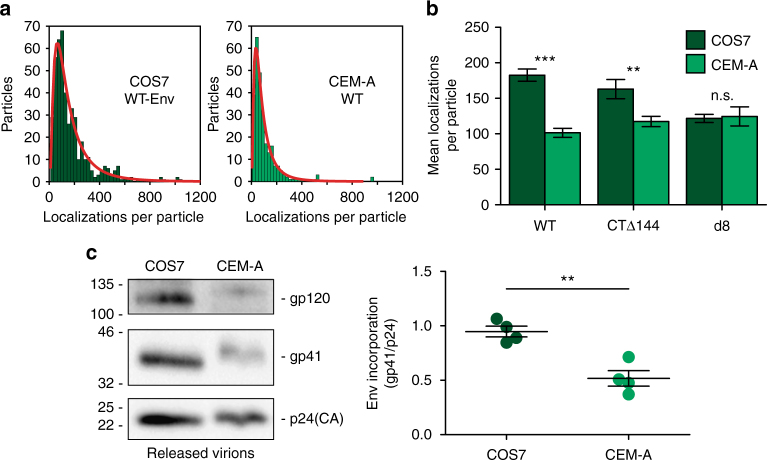
Fig. 6.
Differential Env incorporation between producer cell types suggests that intracellular retention acts to regulate virus association. a Qualitative assessment of the mean number of Env trimers per cell-associated Gag cluster was quantified by counting the number of Env superresolution localizations. Histograms were generated and fit to a lognormal distribution to quantify the mean and standard deviation of the number of Env localizations within each segmented assembly site volume. It is important to note that localization count is not a direct quantification of molecule count due to the variable number of fluorophores per antibody, the unknown labeling stoichiometry per Env trimer, and the repeated appearance of a single fluorophore during a single superresolution experiment. As the aforementioned factors are consistent for each experimental condition, localization counts will be generally proportional to molecule counts. b The parameters of the lognormal fits of each distribution were used to compare general levels of Env incorporation between producer cell types for each Env genotype. Bars represent means and s.e.m. of Env channel localizations per particle (WT COS7 = 182.6 ± 8.6; WT CEM-A = 101.5 ± 6.3; CTΔ144 COS7 = 163.1 ± 13.5; CTΔ144 CEM-A = 117.4 ± 7.2; d8 COS7 = 121.7 ± 5.8; d8 CEM-A = 124.6 ± 13.4). See Supplementary Table 1 for n values. ***P < 0.0001, **P < 0.005, n.s. P = 0.8445 as assessed by a two-tailed unpaired t-test with Welch’s correction. c Western blots of released virions were used to assess levels of WT-Env incorporation in virus produced by CEM-A versus COS7 cells. Levels of gp41 (Env) were normalized to the amount of p24 (Gag). Virus produced by COS7 cells displayed a mean ratio of 0.95 ± 0.10 gp41 to p24 (n = 4), whereas virus produced by CEM-A cells displayed a mean ratio of 0.52 ± 0.14 gp41 to p24 (n = 4). Bar graph on the right represents mean and s.d. **P < 0.005 as assessed by a two-tailed unpaired t-test

