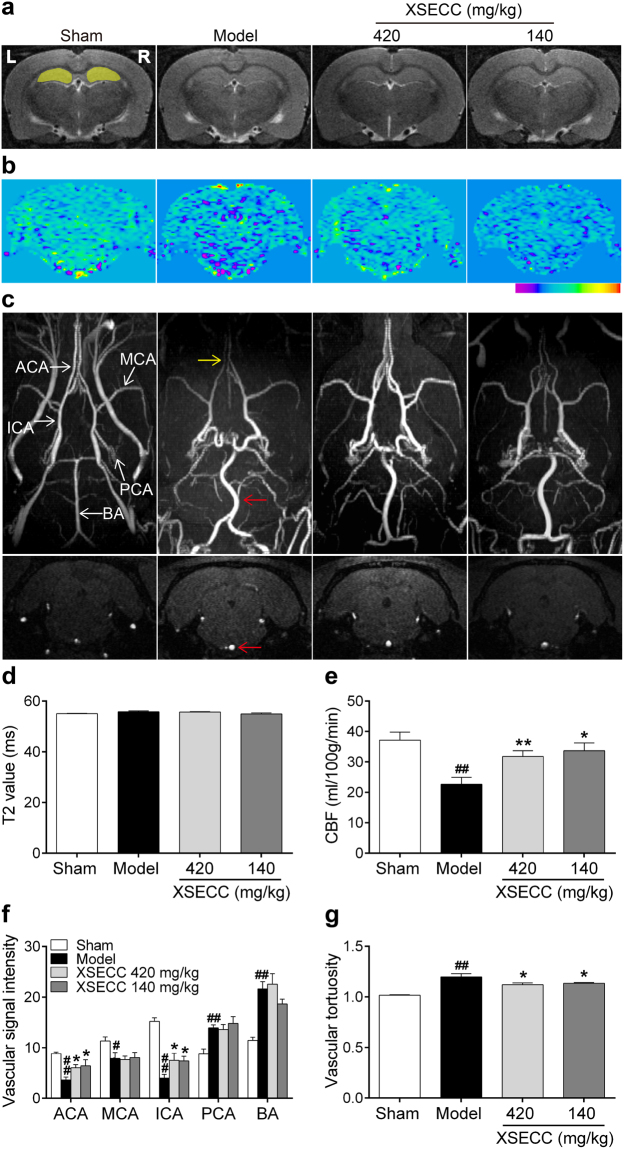
Figure 2.
Effects of XSECC on cerebral vessels and cerebral blood flow in BCCAO rats. (a) Representative T2 relaxometry images of various group rats. The yellow cover on the sham group indicated ROIs of the bilateral hippocampus (R, right; L, left). (b) Typical CBF maps obtained from ASL at the hippocampus level (−3.8 mm relative to bregma). (c) Representative axial MIP maps (upper panel) and coronal data set images (lower panel) of MRA exhibited relatively distinguished cerebral vessels. ACA, MCA, ICA, PCA and BA were identified in the sham group map (ACA, anterior cerebral artery; MCA, middle cerebral artery; ICA, internal carotid artery; PCA, posterior cerebral artery; BA, basilar artery). The red arrow presented the signal-enhanced and tortuous BA, and the yellow arrow presented the weaken signal of ACA. Quantitation of hippocampal T2 values (d), hippocampal CBF (e), and vascular intensity of ACA, MCA, ICA, PCA, BA (f) and vascular tortuosity of BA (g). #P < 0.05, ##P < 0.01 vs. sham group; *P < 0.05, **P < 0.01 vs. model group (one-way ANOVA followed by LSD’s post hoc test, n = 6 per group).

