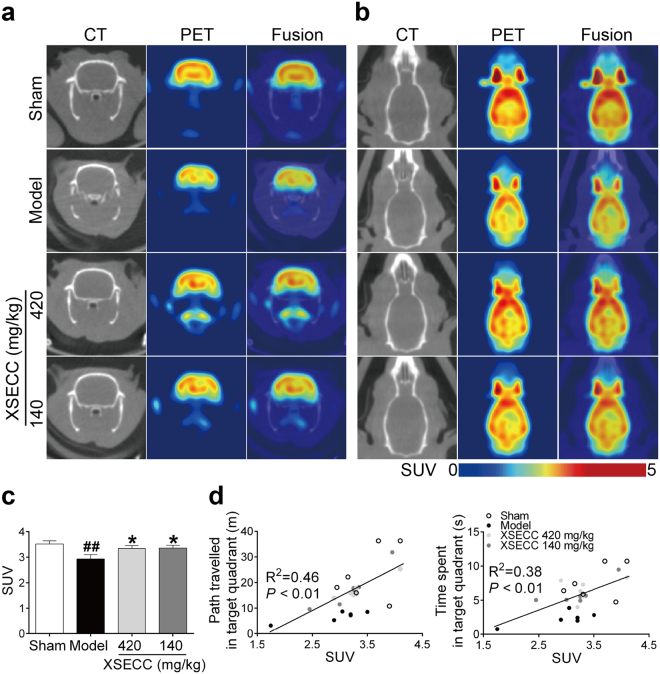
Figure 3.
Effects of XSECC on glucose metabolism in BCCAO rats. 18F-FDG PET images of the (a) coronal and (b) axial planes. PET images are co-registered with the CT of the same animal to localize anatomically the PET signal. (c) Quantitative analysis of SUV of 18FDG in the hippocampus. ##P < 0.01 vs. sham group; *P < 0.05, **P < 0.01 vs. model group (one-way ANOVA followed by LSD’s post hoc test, n = 6 per group). (d) Person correlational analysis of the hippocampal SUV and Morris water maze parameters of the probe test. A positive correlation was found between the hippocampal SUV and path (Pearson R2 = 0.46, P = 0.0002), time spent in the target quadrant (Pearson R2 = 0.38, P = 0.0013) of the probe test (Pearson correlational analysis).

