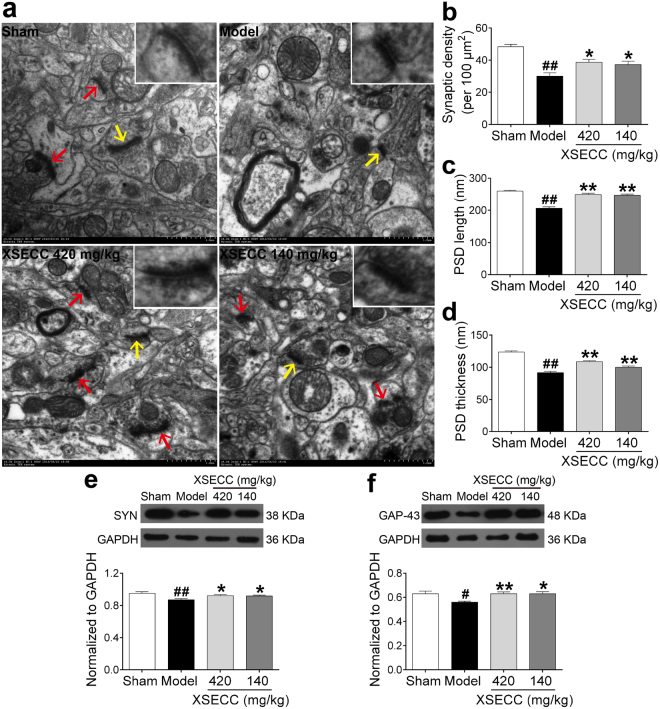
Figure 6.
Effects of XSECC on neuronal plasticity in BCCAO rats. Twenty random images (8000×) were taken for the analysis of synaptic density and another twenty high magnification images (20000×) were taken for the analysis of PSD. (a) Typical TEM images of synaptic ultrastructure from sham, model and XSECC group rats (Scale bar = 500 nm, n = 2 per group). Synapses were identified by arrows and a magnified synapse (from the synapse indicated by yellow arrow) was displayed on the top right corner of the TEM images. Quantitation showed synaptic density (b), PSD length (c) and thickness (d) in the model group rats were significantly elevated by XSECC. Western blot analysis of the SYN protein expression (e) and GAP-43 protein level (f) in the hippocampus (n = 6 per group). #P < 0.05, ##P < 0.01 vs. sham group; *P < 0.05, **P < 0.01 vs. model group (one-way ANOVA followed by LSD’s post hoc test).

