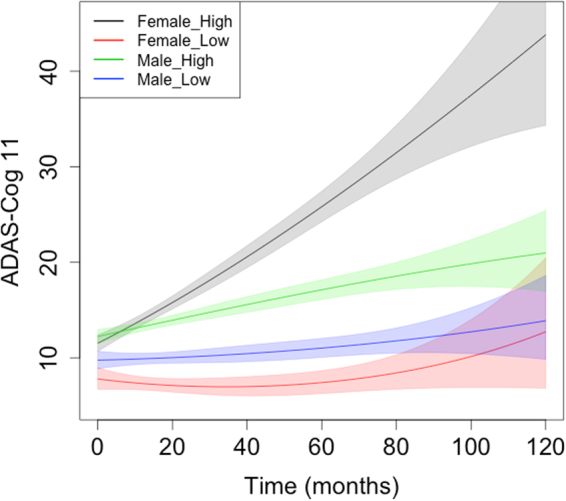
Figure 2.

ADAS-Cog11 Slopes in subjects with high or low probability of MCI due to AD. X-axis depicts maximum duration of follow up. Y-axis depicts ADAS-Cog11 scores. MCI subjects have been grouped using CSF t-tau/Aβ42 ratio as having “high” or “low” probability of MCI due to AD. Slopes and confidence intervals are derived from a simple quadratic model (polynomial regression) by sex over time without any other covariates. Data comprises pooled MCI subjects from ADNI-1 and ADNI-2. Female subjects with high probability of MCI due to AD showed greater decline than the other groups.
