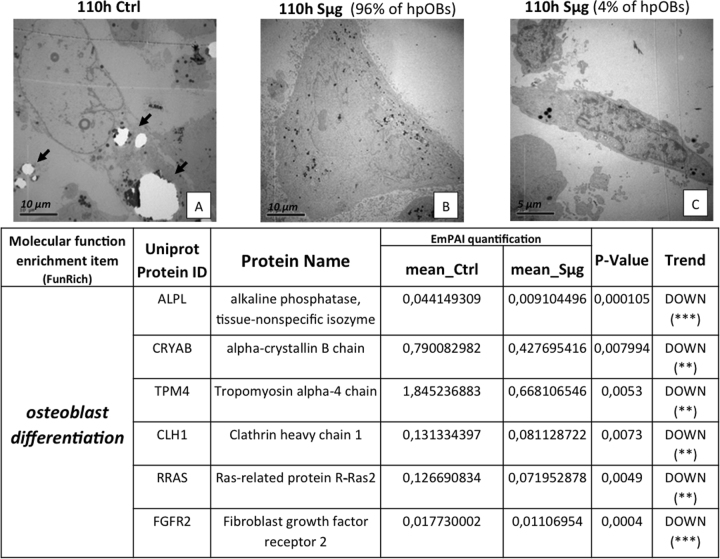
Fig. 2. Loosening of osteoblast phenotype induced by Sμg.
Upper panel: TEM micrographs of hpOBs. a Normo-gravity control mature hpOBs micrograph taken at 110 h time point. Ultrastructural image show osteoblast cell with intracellular granules of HA crystals (highlighted by arrows). b Mature osteoblasts exposed to 110 h Sμg. Image represent 90% of cells, which show large cells without both profuse endoplasmic reticulum and intracellular granules of HA crystals. c Representative TEM micrograph of 4% of cell after 110 h Sμg. Images display a “mesenchymal-like” cell induced from 110 h-Sμg treatment. Lower panel: Downregulation of pro-osteogenic proteins. The tables reports differential spectral-counts between normo-gravity and Sμg conditions. Protein content was estimated as normalized EmPAI values as percentage according to Shinoda et al. The table shows proteins differentially regulated in abundance with statistical significance. *p < 0.05; **p < 0.01; ***p < 0.001, and unique proteins in normo-gravity (UN) and microgravity (UM)

