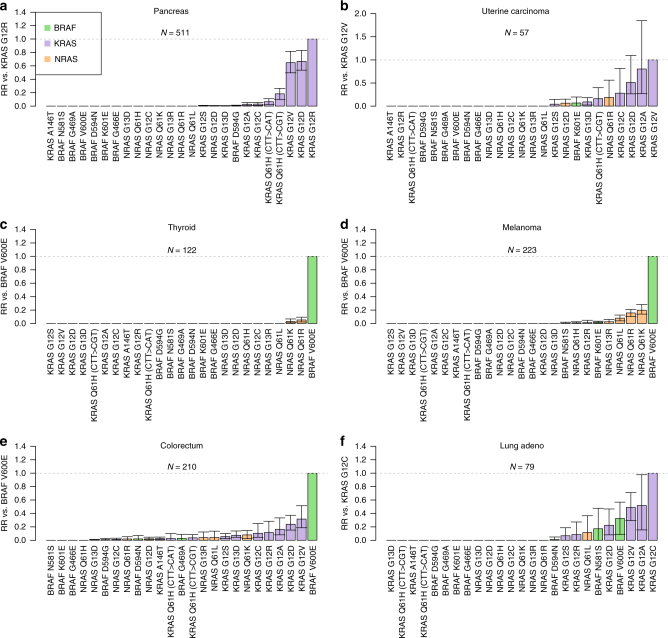
Fig. 4.
Evidence for differential selection between mutations in KRAS, BRAF and NRAS. Bar plots show modelled relative risk of KRAS, BRAF, and NRAS mutations (compared with a reference mutation). a Modelled relative risk of KRAS, BRAF and NRAS, mutations compared to KRAS G12R in pancreatic cancer. b As above, with comparison to KRAS G12V mutations in uterine carcinoma. c As above, with comparison to BRAF V600E mutations in thyroid cancer. d As above, with comparison to BRAF V600E mutations in melanoma. e As above, with comparison to BRAF V600E in colorectum. f As above, with comparison to KRAS G12C in lung adenocarcinoma. Confidence intervals obtained by bootstrapping across 100 iterations. Error bars represent 95% confidence intervals obtained by bootstrapping across 100 iterations. N indicates total number of samples used for the analysis within each cancer type

