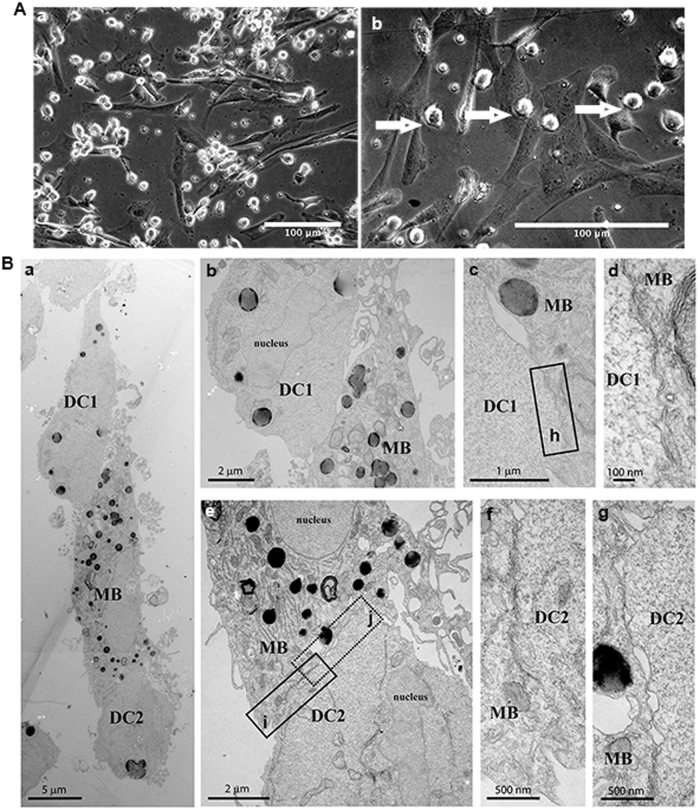
Fig. 1. Close contact during co-culture between DCs and myoblasts or myotubes.
A Phase contrast microscopy of myoblasts co-cultured with actDCs (LPS 100 ng/mL) (a and b) for 48 h. a represents a low magnification and b a higher magnification. Bars represent 100 μm. B Transmission electron microscopy of myoblasts and actDCs (LPS 100 ng/mL) co-cultured in proliferation medium for 48 h (a). Different magnifications of the close contact area of myoblast (MB) and DC1 (b, c, d), while (d) is the high magnification of the rectangle (h) in (c). Different magnifications of the close contact area of myoblast (MB) and DC2 (e, f, g), while (f, g) are high magnifications of the rectangles (i, j) seen in (e), respectively. Bars represent 5, 2, 1, 100, and 500 nm. Data are representative of three independent experiments

