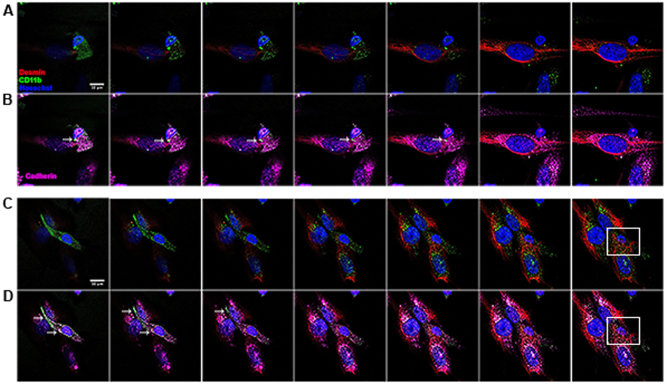
Fig. 2. Confocal images of close contact between actDCs and myoblasts.
Myoblasts were co-cultured with actDCs for 48 h, fixed and stained for image acquisition. Two different fields were captured to evaluate the close contact between the cells. a and b represent the Z-axis stacks of one field, whereas c and d represent the other field. Red desmin, green CD11b, blue nucleus, purple cadherin. The white arrow indicates the putative cell contact. The white square highlights the engulfment of the DCs by the myoblast. Data are representative of two different experiments

