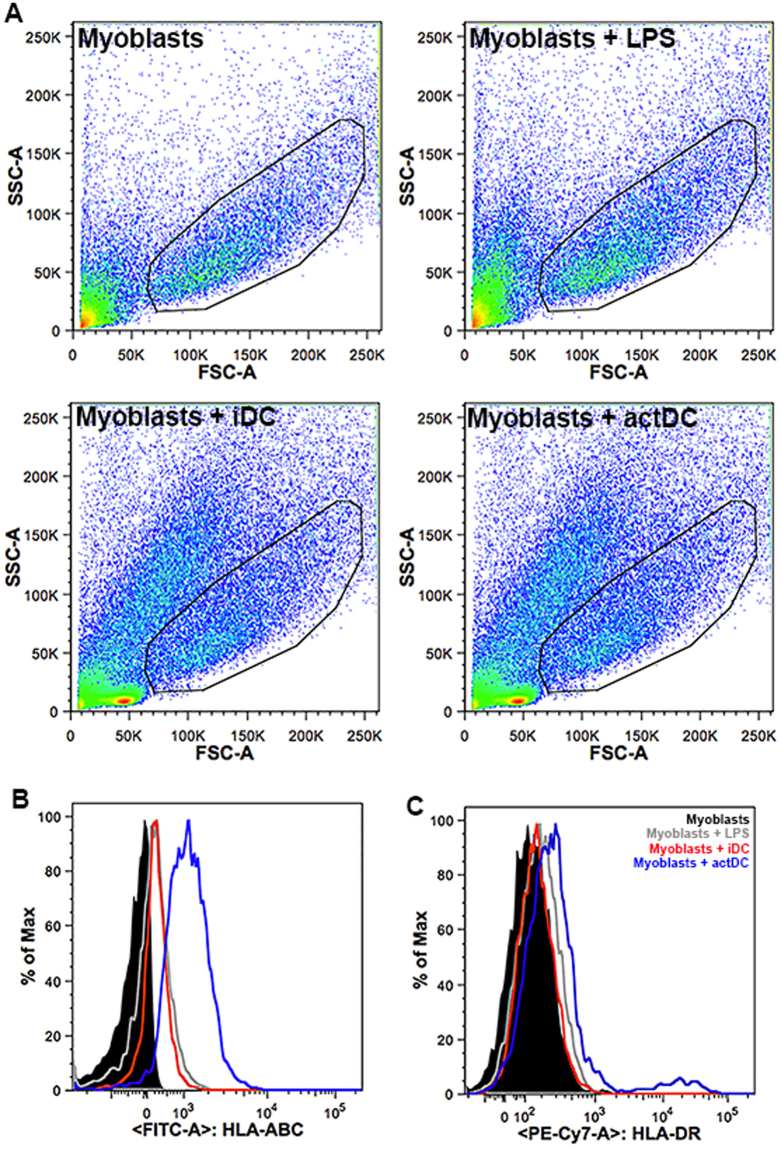
Fig. 3. HLA-ABC and HLA-DR expression on myoblasts is increased during the co-culture with actDCs.
Myoblasts were seeded in co-culture with iDC or actDCs, the cells were recovered, stained and analyzed by flow cytometry. a Dot-plots from myoblasts, myoblasts incubated with LPS (100 ng/mL), myoblasts incubated with iDC and myoblasts incubated with actDCs. The gated cells are CD56+ myoblasts. b, c reveal HLA-ABC and HLA-DR histograms, respectively, from myoblasts and DC co-culture, discriminated as black line myoblasts, gray line myoblasts + LPS, red line myoblasts + iDC, blue line myoblasts + actDCs. Data are representative of three different experiments

