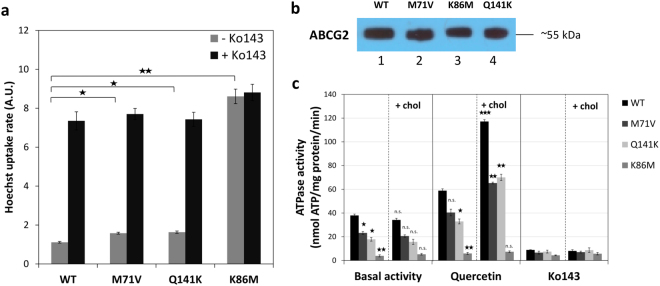
Figure 3.
Functional analysis of ABCG2 and its variants in cellular expression systems. (Panel a) ABCG2-dependent Hst dye extrusion in HEK 293 cells. The initial slopes were determined from the kinetic curves of cellular dye accumulation assessed by flow cytometry in the absence and presence of Ko143, a specific inhibitor of ABCG2 inhibitor (n = 3, ±SE, significance determined by Student’s t-test). (Panel b) Expression levels of ABCG2 variants (Wt, M71V, Q141K, and K86M) in isolated Sf9 membranes, as measured by Western blotting, using the BXP-21 antibody. The different proteins examined in the Western blot were developed by the respective antibodies and cropped from the indicated parts of the same gel and blot. (Panel c) ABCG2-ATPase activity in isolated Sf9 membranes, expressing the ABCG2 (Wt, M71V, Q141K, and K86M) variants. Vanadate-sensitive ATPase activity in the absence or presence of membrane cholesterol was measured, either in the absence of additional compounds (basal activity), in the presence of 10 µM quercetin, providing maximum drug-stimulated activity, or in the presence of 5 µM Ko143. (±SEM, significant differences were determined with Student’s t-test) In the left panels (without cholesterol), the mutant variants were compared to wild type, whereas in the right panels (with cholesterol) cholesterol-treated membrane preparations were compared to the corresponding untreated samples. *p < 0.05, **p < 0.01, ***p < 0.001.

