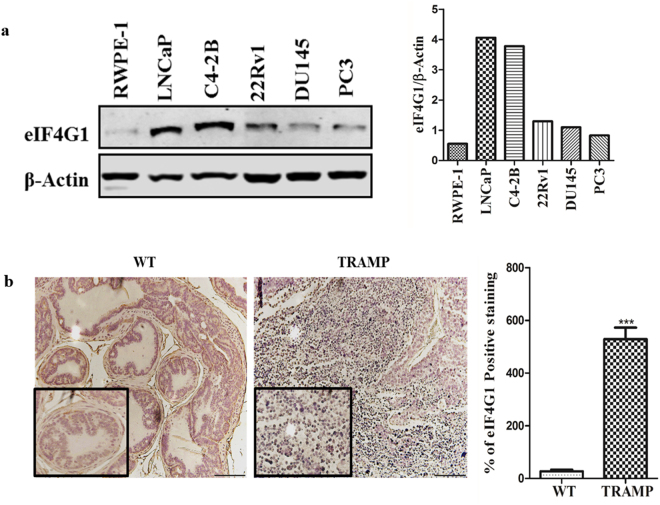
Figure 3.
eIF4G1 expression is increased in PCa cell lines in comparison to normal cell line and during tumor progression in tissue sections from TRAMP mice: eIF4G1 expression in cell lines and tumor tissue: (a) eIF4G1 expression in PCa cell lines by Western Blot; (The adjacent graph is quantitation of western blot). (b) Photomicrograph of IHC for eIF4G1 expression on prostate tissue section from wild-type (WT) & 30 Week Old TRAMP mice (Images are X20, inset X40); (The Adjacent graph is quantitation). Error bars represents ± SD. p-values are indicated as *<0.05, **<0.01, ***<0.001.

