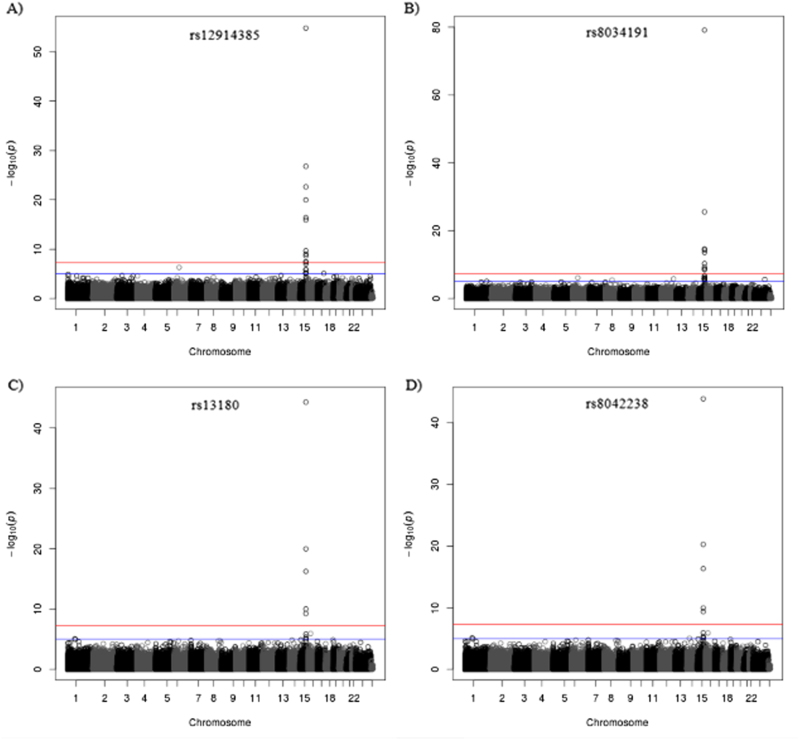
Fig. 1.
Plotted results of the discovery EWAS of the four SNPs at chromosome 15. In circles are represented all CpGs throughout the genome. The x-axis shows all chromosomes. The y-axis shows negative logarithm of the P-value of the associations of a rs12914385:C>T, b rs8034191:T>C, c rs13180:C>T and d rs8042238:C>T with epigenome-wide DNA methylation levels. Upper line represents the significance threshold (FDR < 0.05). N = 723

