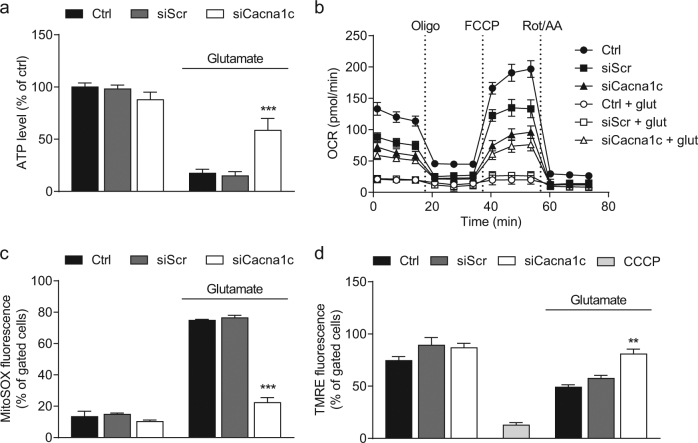
Fig. 3. Downregulation of Cacna1c gene expression mediated protection of mitochondrial function against glutamate-induced oxidative stress.
a A luciferase-based assay was used to determine ATP levels in glutamate-exposed (8 mM) HT22 cells. Values from eight replicate wells per condition are displayed as mean + SD. The luminescence under control conditions is set as 100%. b After 16 h of glutamate challenge, the oxygen consumption rate (OCR) was analyzed with a Seahorse XFe96 Analyzer. Data of 3–7 replicate wells per condition are given as mean ± SD. Oligo oligomycin, FCCP carbonyl cyanide 4-(trifluoromethoxy)phenylhydrazone, Rot rotenone, AA antimycin A. c Mitochondrial superoxide formation was investigated by flow cytometry using the fluorescent dye MitoSOX. HT22 cells were treated with 9 mM glutamate for 18 h. d Flow cytometric analysis of the mitochondrial membrane potential was realized via TMRE staining after 18 h of glutamate treatment. CCCP (carbonyl cyanide 3-chlorophenylhydrazone, 50 µM) is a mitochondrial membrane depolarizer and serves as positive control. c, d Each bar chart depicts one representative experiment with three replicates per sample (mean + SD; 10,000 cells per replicate). ***p < 0.001; **p < 0.01 compared to glutamate-treated ctrl (ANOVA, Scheffé’s-test)

